Introduction
The Mule 4 OpenTelemetry Module is a custom MuleSoft extension developed for instrumenting MuleSoft applications to export tracing specific telemetry data to any OpenTelemetry compliant collector. Using the module now allows Mule applications to take on an active role in distributed tracing scenarios and be insightful and actionable participants in the overall distributed trace.
| This document is, intentionally, a bit long as it contains some background details on the motivation for building the extension as well as some design details on the extension itself. However, if you prefer to skip past the "why" and "what" material (no offense taken but I did put some extra effort into generating the diagrams) and get right to the "how", simply go to The How on the Mule 4 OpenTelemetry Module section of the document. |
The Why on the Mule 4 OpenTelemetry Module
The motivation behind developing this extension is predicated on two primary concerns as it relates to the enterprise and the software they develop - a business concern and a technical concern.
Digital Experience Monitoring
At a strategic level, that is, at the business level, the goal is to better champion the DEM (Digital Experience Monitor) strategies and solutions enterprises either currently have in place or are rapidly starting to invest in, especially with the need to support and enhance the hugely popular "work-from-home" experience.
DEM is not necessarily a new technology solution; rather, it’s a progression and aggregation of existing technologies such Application Performance Monitoring (APM), Endpoint Monitoring (EM), Real User Monitoring (RUM), Synthetic Transaction Monitoring (STM), Network Performance Monitoring and Diagnostics (NPMD) and a number of others.
Gartner has a somewhat expanded definition of DEM:
Digital experience monitoring (DEM) technologies monitor the availability, performance and quality of experience an end user or digital agent receives as they interact with an application and the supporting infrastructure. Users can be external consumers of a service (such as patrons of a retail website), internal employees accessing corporate tools (such as a benefits management system), or a combination of both. DEM technologies seek to observe and model the behavior of users as a continuous flow of interactions in the form of user journeys.
The Gartner definition of DEM, while comprehensive, is a bit of a mouthful. A (much) simpler definition is:
DEM allows an enterprise to provide the best experience possible to all customers.
In order to better support the business aspirations for insightful and actionable DEM, I believe these two technical capabilities are necessary prerequisites at the IT level:
-
Composability
-
Observability
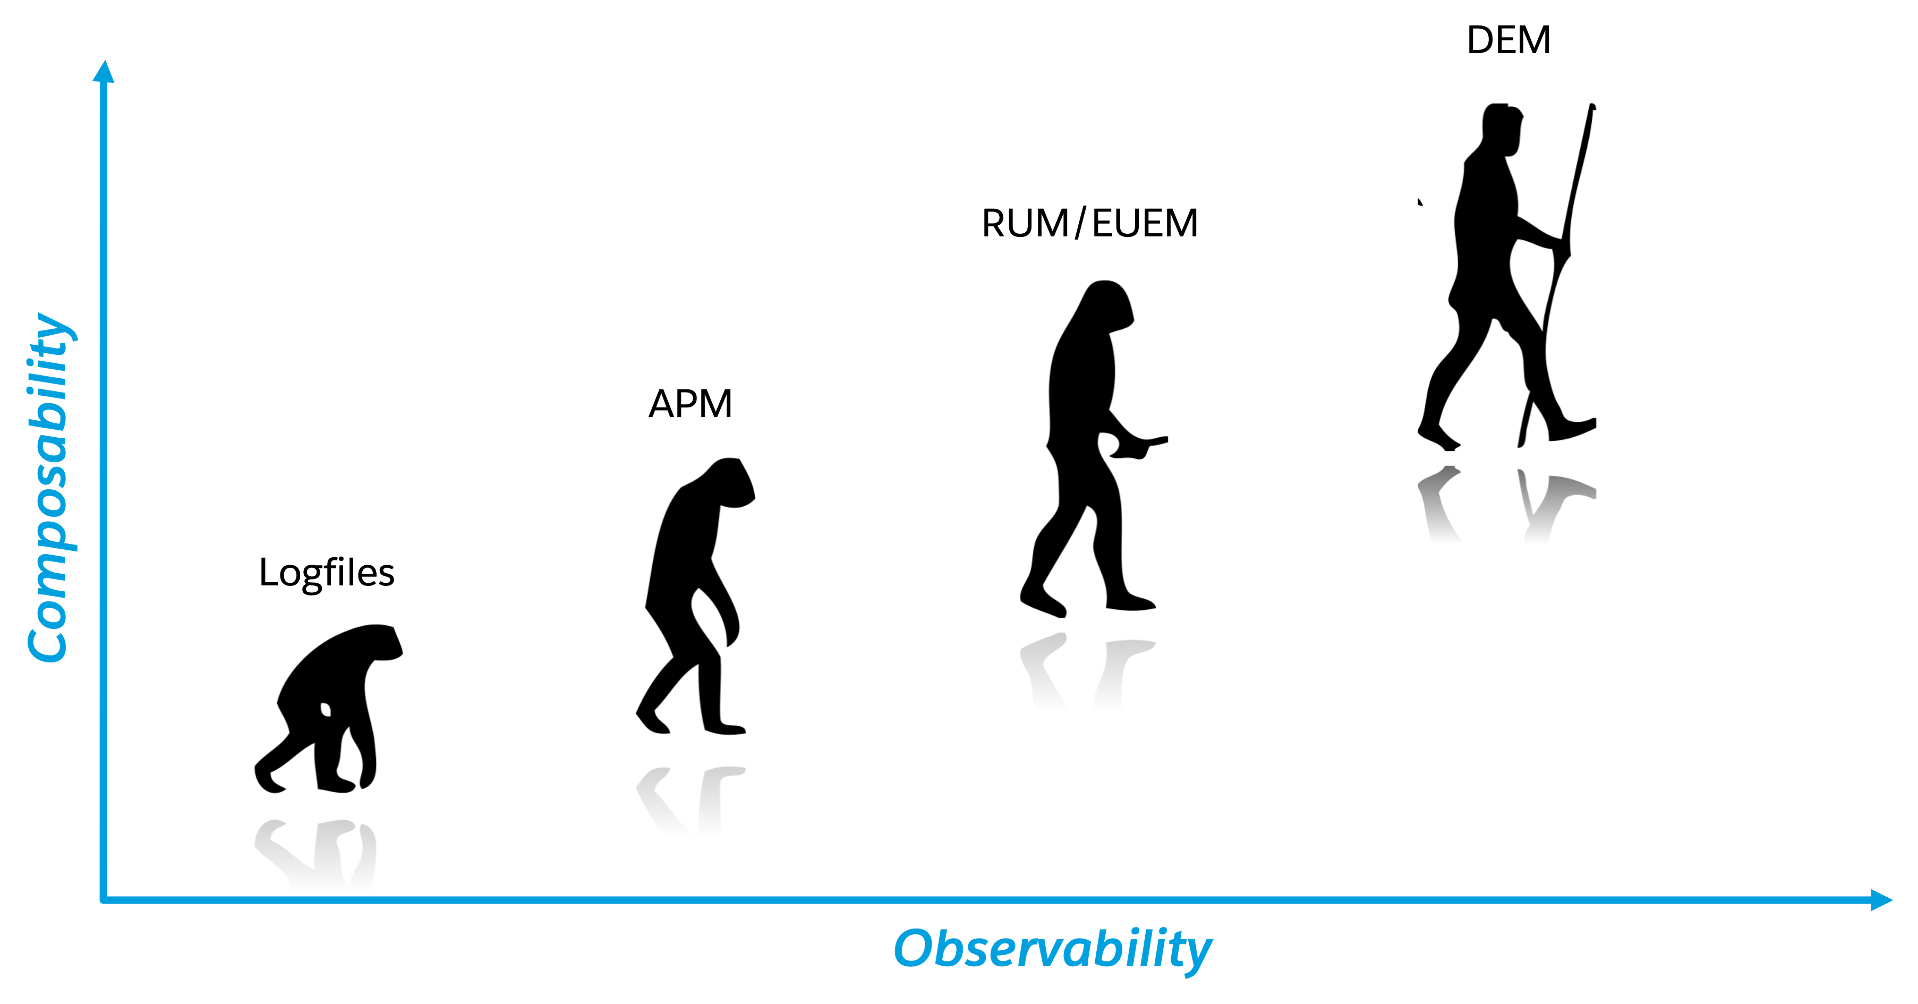
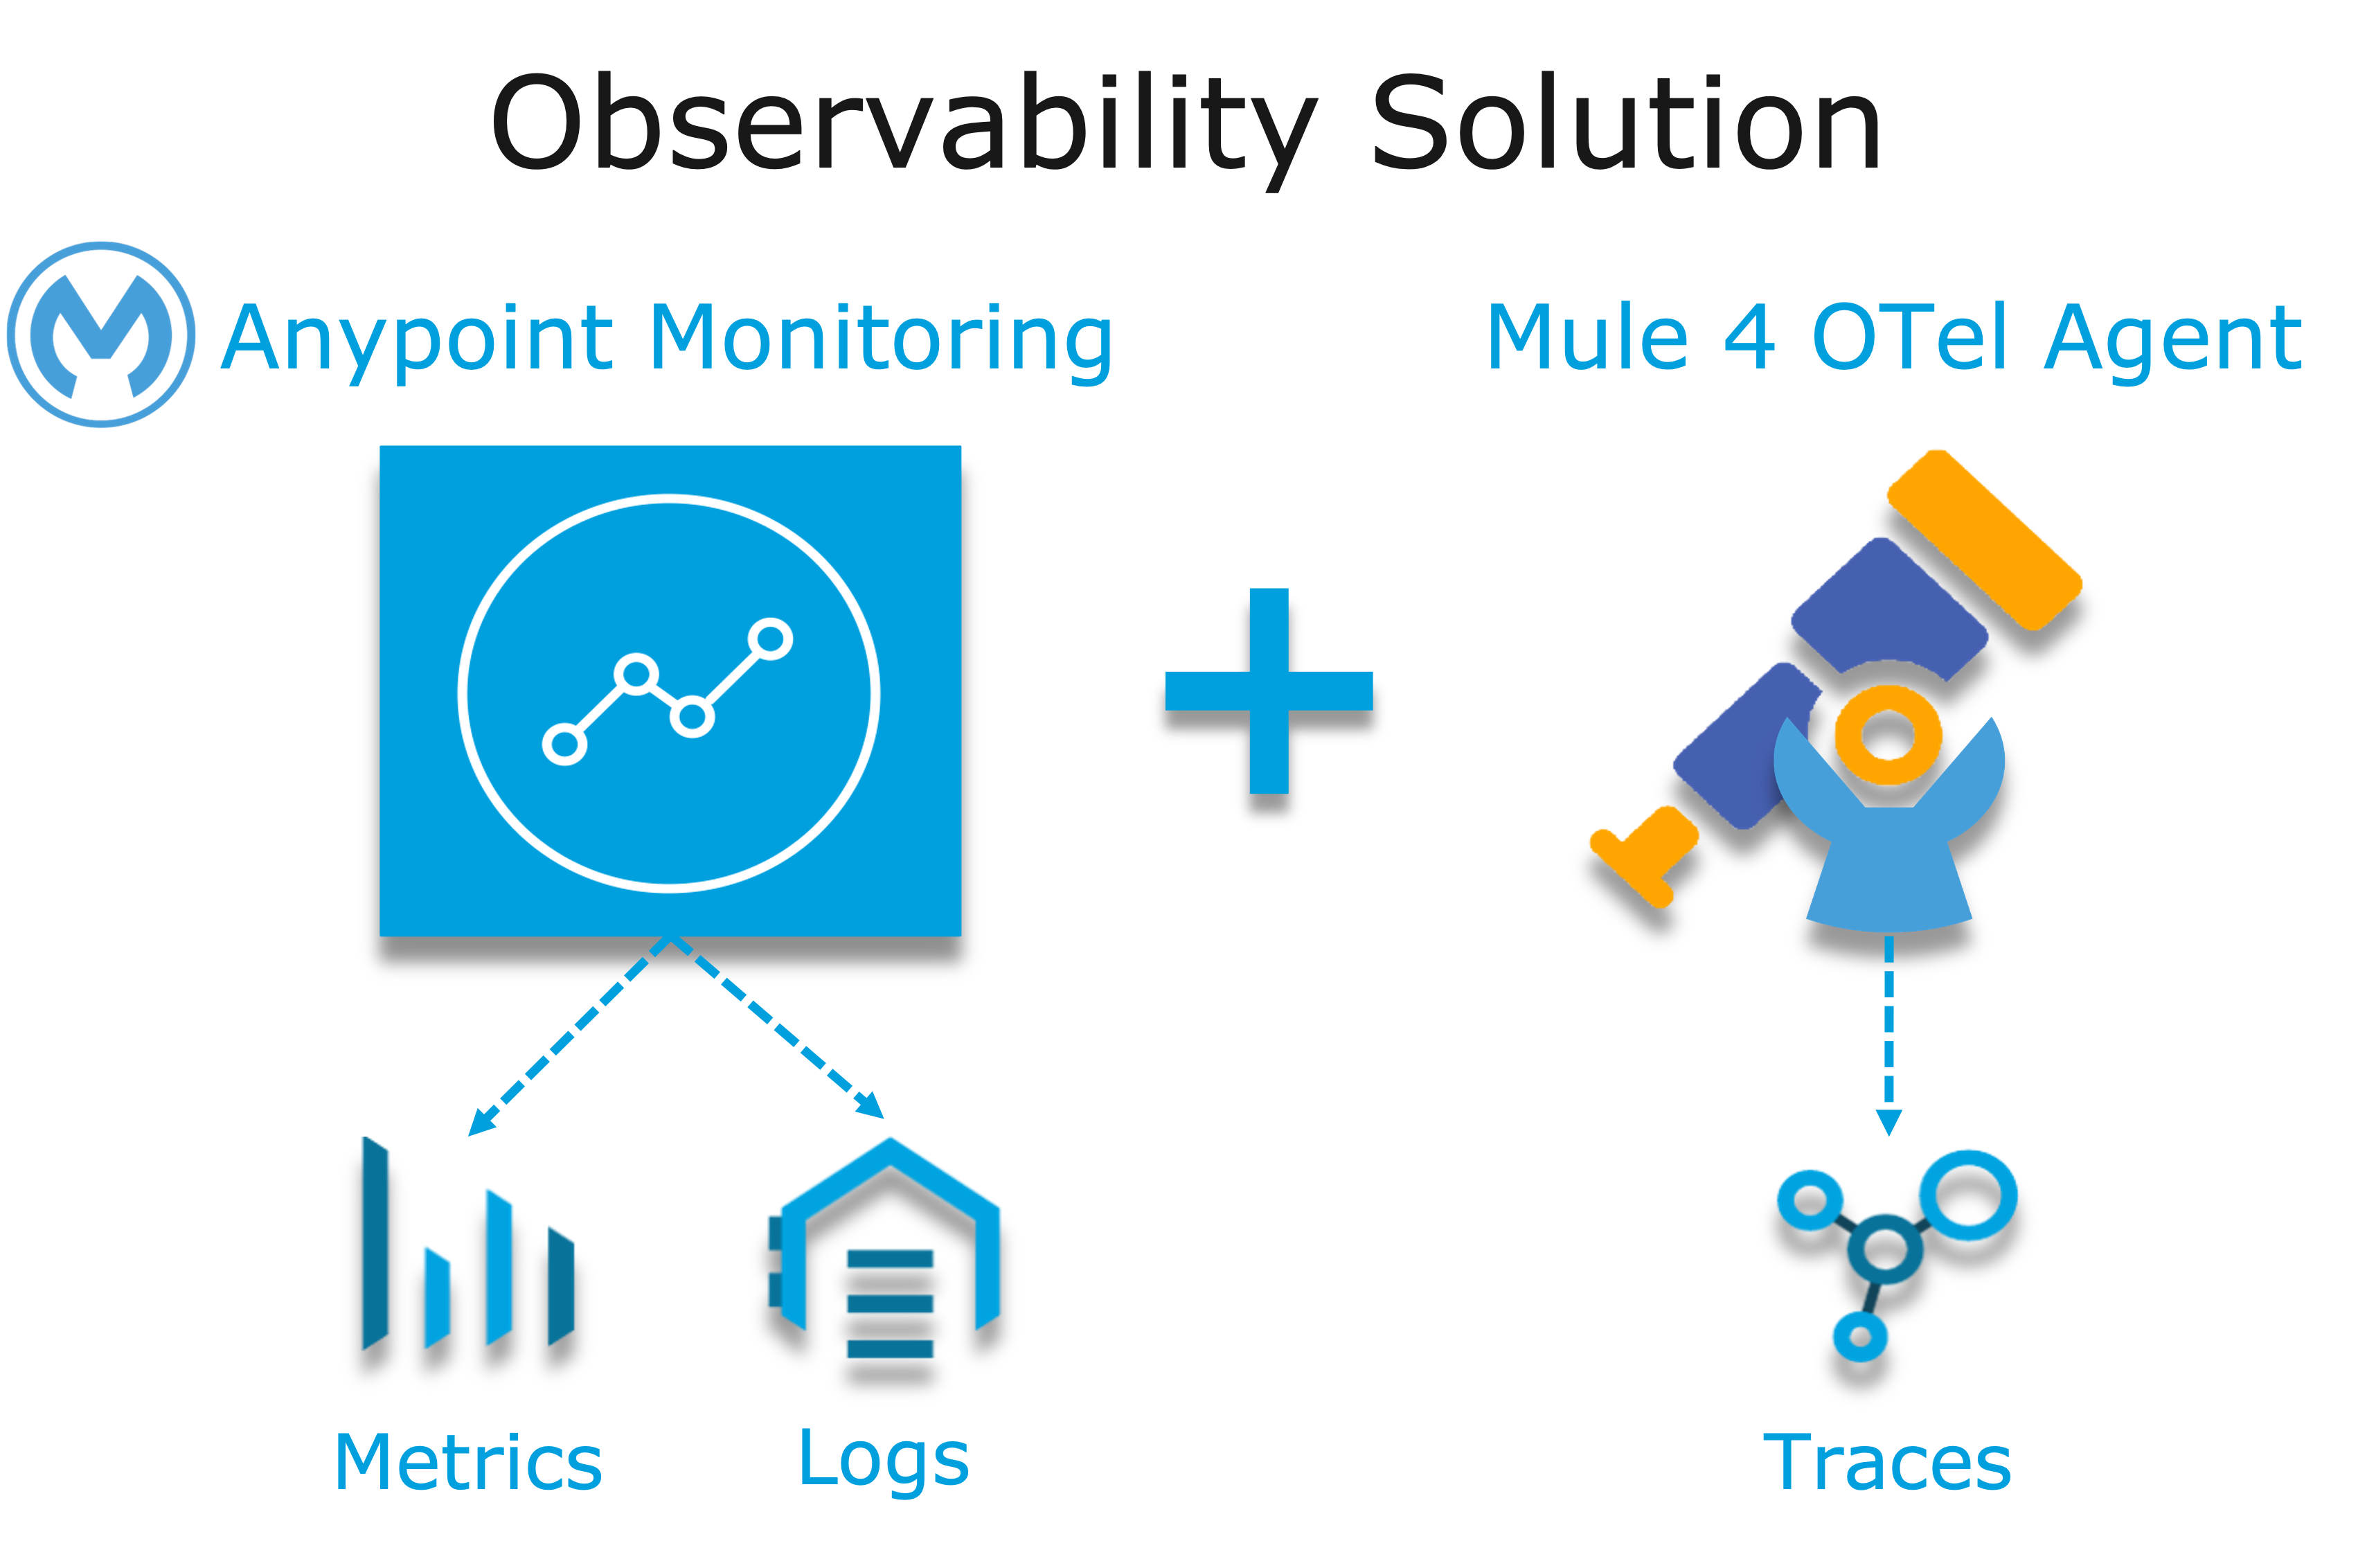
As depicted in the graphic above, DEM is an evolutionary progression of monitoring technology which serves high composability and leverages greater observability. The next two sections will describe both concepts in more detail.
Composability
Well, as you might imagine, there are plenty of theoretical, complex and technical answers to this question - just Google it to get a list of the numerous publications on the topic. Since this is not a technical article on the subject of composability, we’ll take a much more modest view of it.
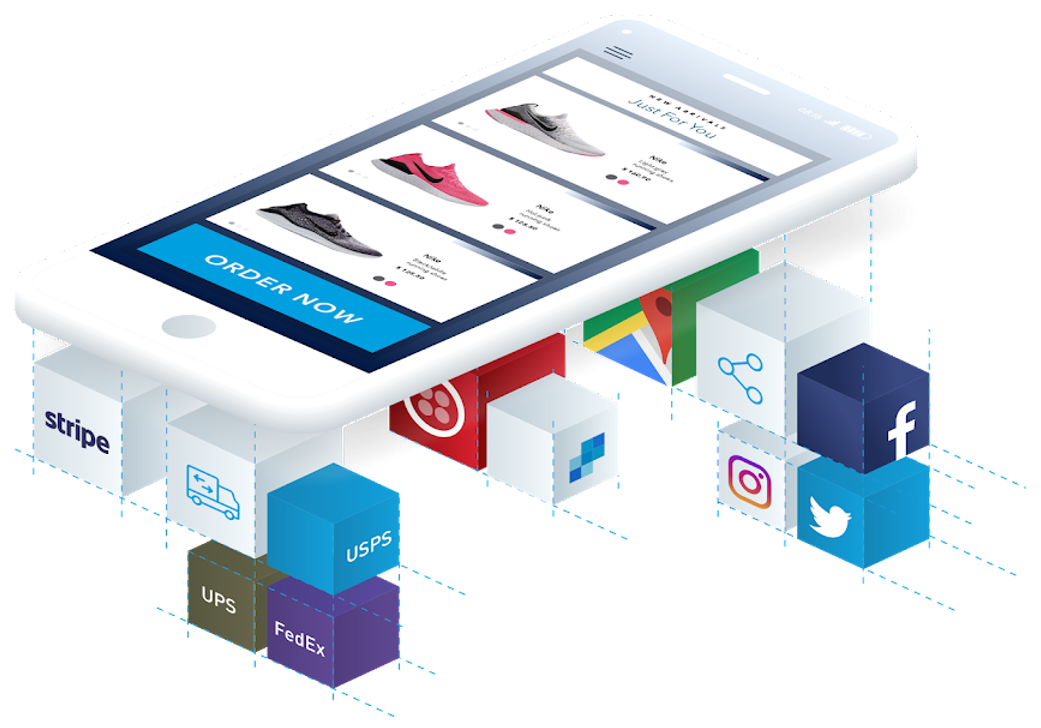
So, in really simple terms, composability is the concept of building stand alone software composed of other stand alone software, in a plug-and-play manner (see figure Example of a Composite Application below) and it matters because enterprises who adopt composability as a core IT practice can achieve much greater agility on delivering new and/or enhanced solutions for business in the face of rapid and ever changing market conditions - does COVID ring a bell?
Basically, the practice of composability is a great way for an enterprise to protect and grow overall revenue in the face of both expected and unexpected change. Do you know when or what the next crisis will be? Exactly…
Composable Enterprise
Gartner defines a Composable Enterprise as an organization that can innovate and adapt to changing business needs through the assembly and combination of packaged business capabilities.
|
Gartner’s definition of composable business operates on four basic principles:
|
Composability must be important because it has its own Gartner definition, right?
So how long before we have true composable enterprises?
From a purist standpoint (i.e., based on the Gartner definition), who knows - maybe never. However, from a practical perspective the "messy" composable enterprise is already here, has been for a while and it’s quickly getting more "pure" over time.
For example,
-
A typical enterprise supports over 900 applications and the number is growing, not shrinking.
-
Growth is happening because of:
-
Accelerated implementation of digital transformation strategies with a cloud-first approach.
-
Rapid adoption of a microservices architecture paradigm.
-
-
-
Typically, no single enterprise application handles a business transaction.
-
A typical business transaction traverses over 35 different systems/applications from start to finish.
-
These systems/applications are often on a variety of disparate and independent technologies stacks - both legacy and modern.
-
These systems are often a combination of on-prem or hosted packaged applications (e.g., SAP ERP, Oracle HCM, Manhattan SCM, etc.), custom coded applications and SaaS applications (e.g., Salesforce, NetSuite, Workday, etc.)
-
-
So as you can see, the composable enterprise already exists and will, rapidly, become more composable over time, especially, with the support of companies like MuleSoft, products like the Anypoint Platform and methodologies like API-Led Connectivity.
Observability
Wikipedia defines observability as:
A measure of how well internal states of a system can be inferred from knowledge of its external outputs. As it relates specifically to software, observability is the ability to collect data about program execution, internal states of modules, and communication between components. This corpus of collected data is also referred to as telemetry.
Another way of looking at observability is having the capacity to introspect, in real-time, complex multi-tiered architectures to better answer the following when things so sideways:
-
Where and why is it broken?
-
Where and why is it slow?
Then, using the gathered observability insights to quickly fix what’s broken and speedup what’s slow.
|
However, I think a more important consideration for observability is an answer to following:
|
Observability Trinity
The obtainment of true observability relies upon 3 core pillars.
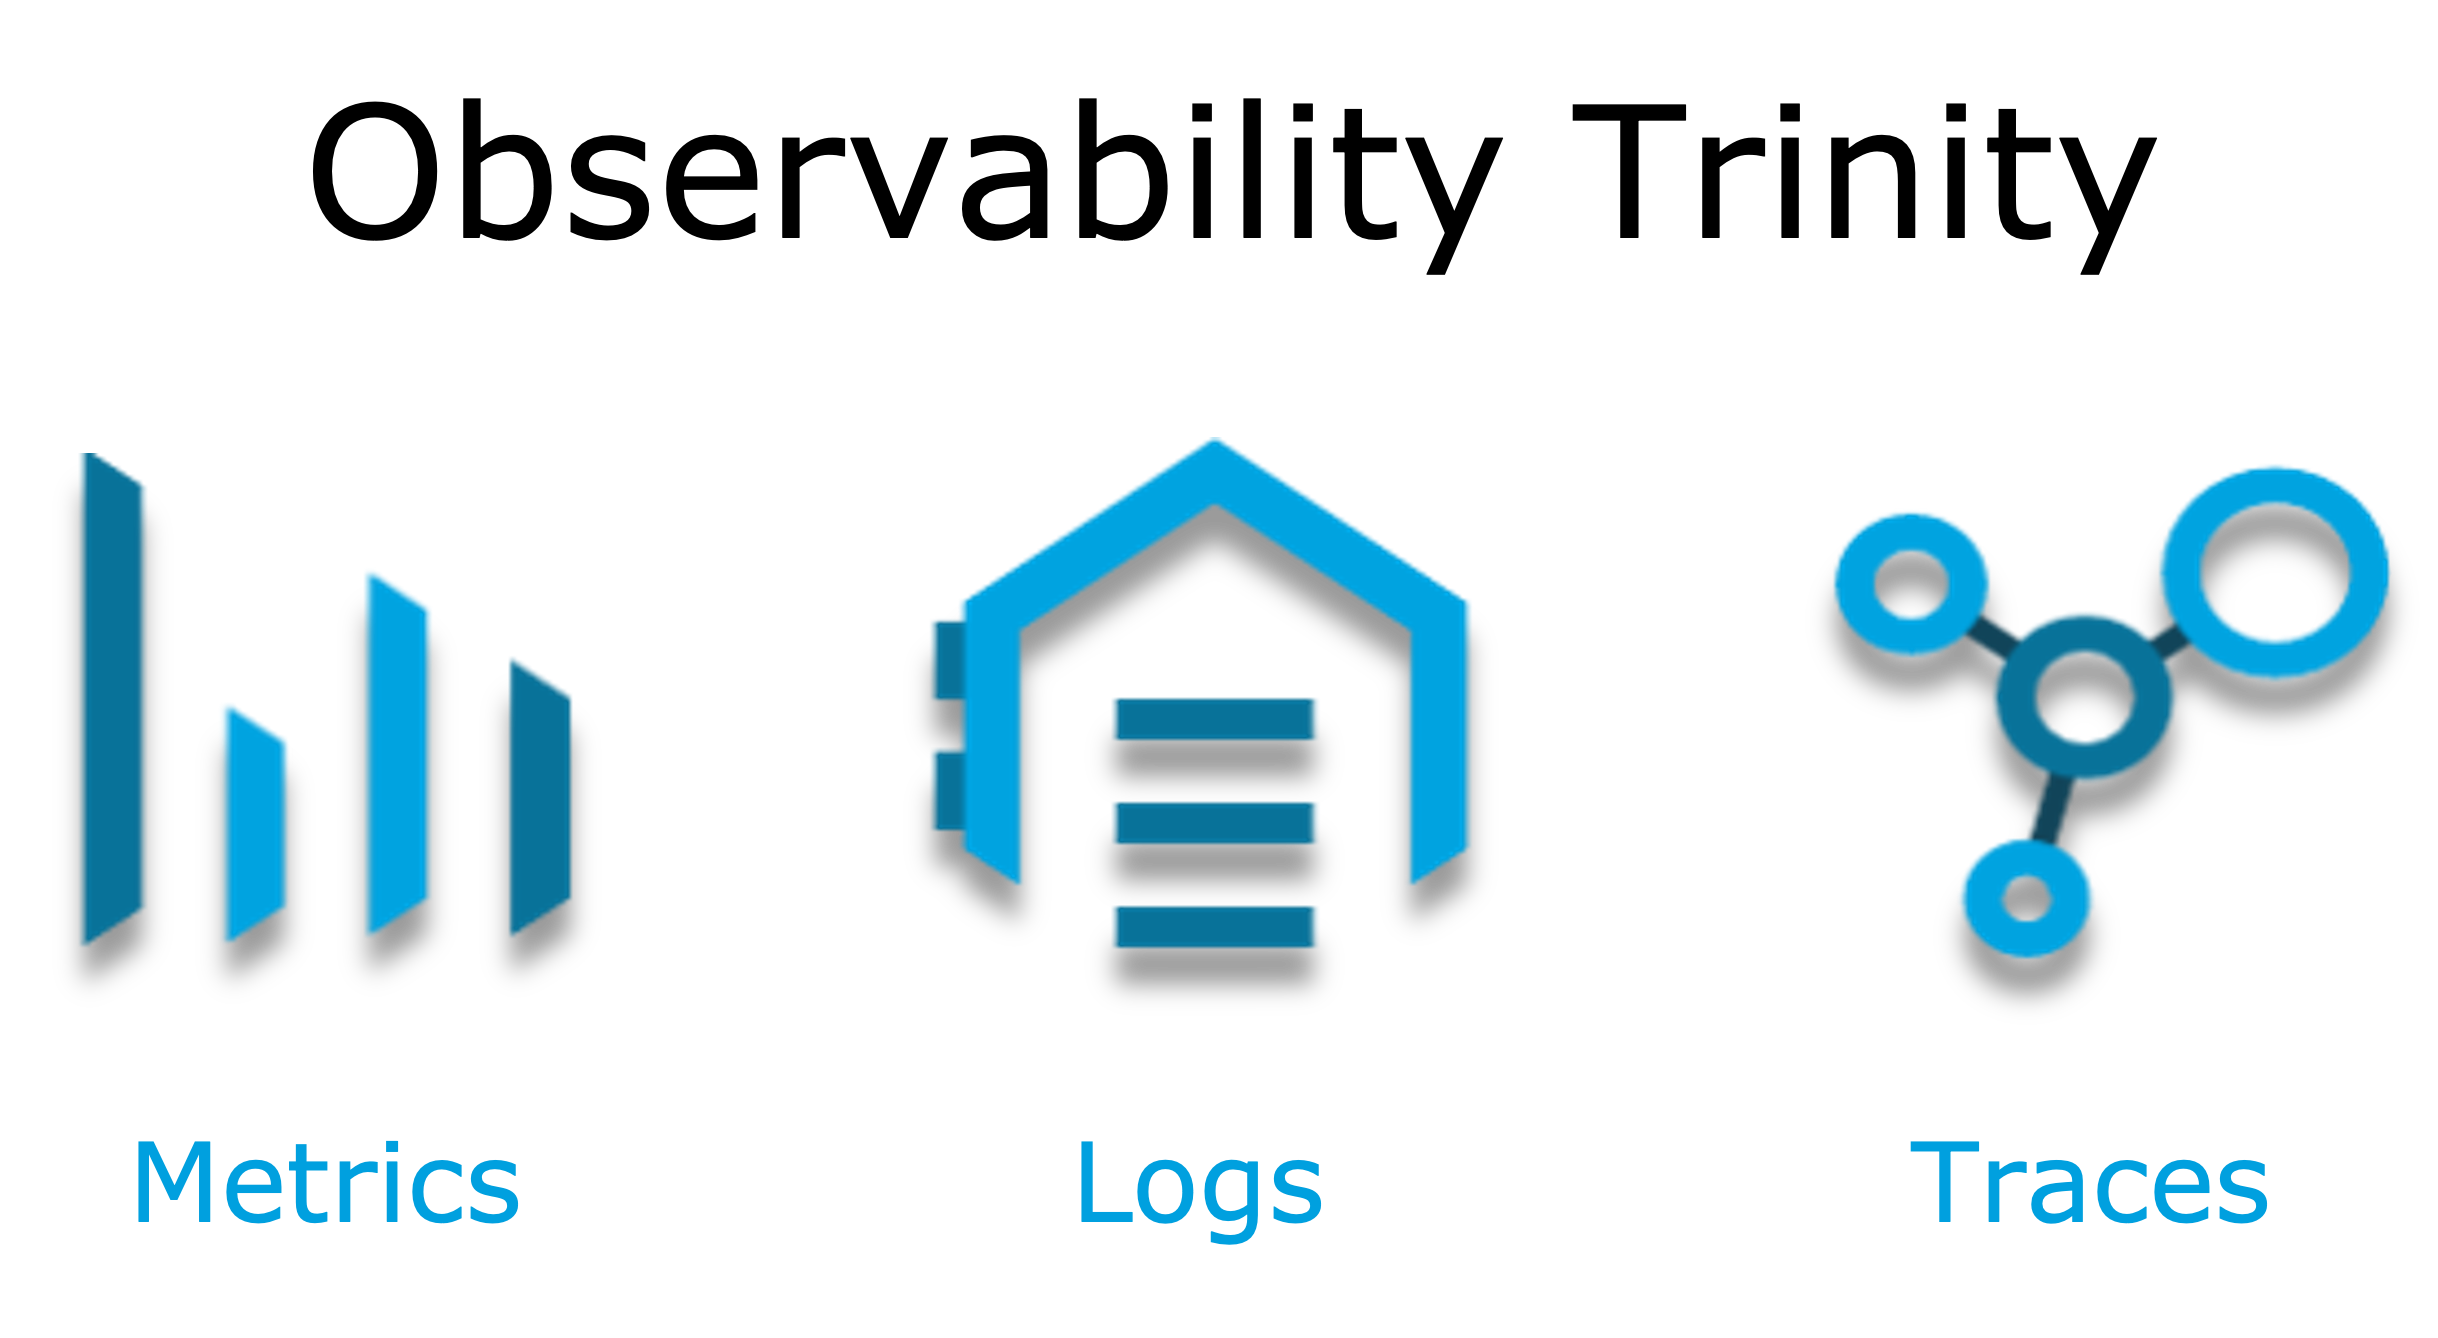
Metrics
A metric is a value that expresses some information about a system. Metrics are usually represented as counts or measures, and are often aggregated or calculated over a period of time. Additionally, metrics are often structured as <name, value> pairs that provide useful behavioral details at both the micro-level and the macro-level such as the following:
Micro-level metrics |
Macro-level metrics |
Memory utilization per service |
Average response time per service |
CPU utilization per service |
Throughput rate per service |
Thread count |
Failure rate per service |
… |
… |
Logs
A log is an immutable, time-stamped text or binary record, either structured (recommended) or unstructured, potentially including metadata. The log record is generated by application code in response to an event (e.g., an error condition) which has occurred during program execution.
[02-22 08:02:50.412] ERROR OnErrorContinueHandler [ [MuleRuntime].uber.18543: [client-id-enforcement-439118-order-api-spec-main].439118-client-id-enforcement.CPU_LITE @5b1b413e] [event: d46fe7b0-93b5-11ec-b9b6-02d407c48f42]:
Root Exception stack trace:
org.mule.runtime.api.el.ExpressionExecutionException: Script 'atributes.headers ' has errors:
...
'hello world'
Traces
A single trace is an event which shows the activity for a transaction or request as it flows through an individual application. Whereas, a distributed trace is an aggregation of one or more single traces when the transaction spans across multiple applications, network, security and environment boundaries. For example, a distributed trace may be initiated when someone presses a button to start an action on a website - such as purchasing a product. In this case, the distributed trace will represent calls made between all of the downstream services (e.g. Inventory, Logistics, Payment, etc.) that handled the chain of requests initiated by the initial button press.
Distributed tracing is the methodology implemented by tracing tools to generate, follow, analyze and debug a distributed trace. Generation of a distributed trace is accomplished by tagging the transaction with a unique identifier and propagating that identifier through the chain of systems involved in the transaction. This process is also referred to as trace context propagation.
Traces are a critical part of observability, as they provide context for other telemetry. For example, traces can help define which metrics would be most valuable in a given situation, or which logs are relevant to a particular issue.
Why is observability important?
The notion of observability is very important to IT organizations because when a business transaction fails or performs poorly within their application network, the team needs the ability to quickly triage and remediate the root cause before there is any significant impact on revenue.
Many IT organizations have and continue to rely upon commercial Application Performance Monitoring (APM) tools (e.g., AppDynamics, Dynatrace, New Relic, CA APM, …) to help them in this regard. While useful, these commercial tools have struggled in the past to provide complete visibility into the overall distributed trace as they deploy vendor specific agents to collect and forward their telemetry.
I state "struggled in the past" because many APM vendors are now starting to embrace and support open source projects like OpenTelemetry for vendor-agnostic instrumentation agent implementations and standards such as W3C Trace Context for context propagation to help them fill in the "holes". See Vendor Support for OpenTelemetry - 2021 below.
So what do composability and observability have to do with each other?
Hopefully, the answer is obvious but as enterprise applications become more and more composable, that is, as enterprises move towards embracing composability as an architectural pattern, the need for observability becomes greater; however, the capacity for implementing observability becomes harder unless there is comprehensive observability strategy and solution in place.
Solving for Observability
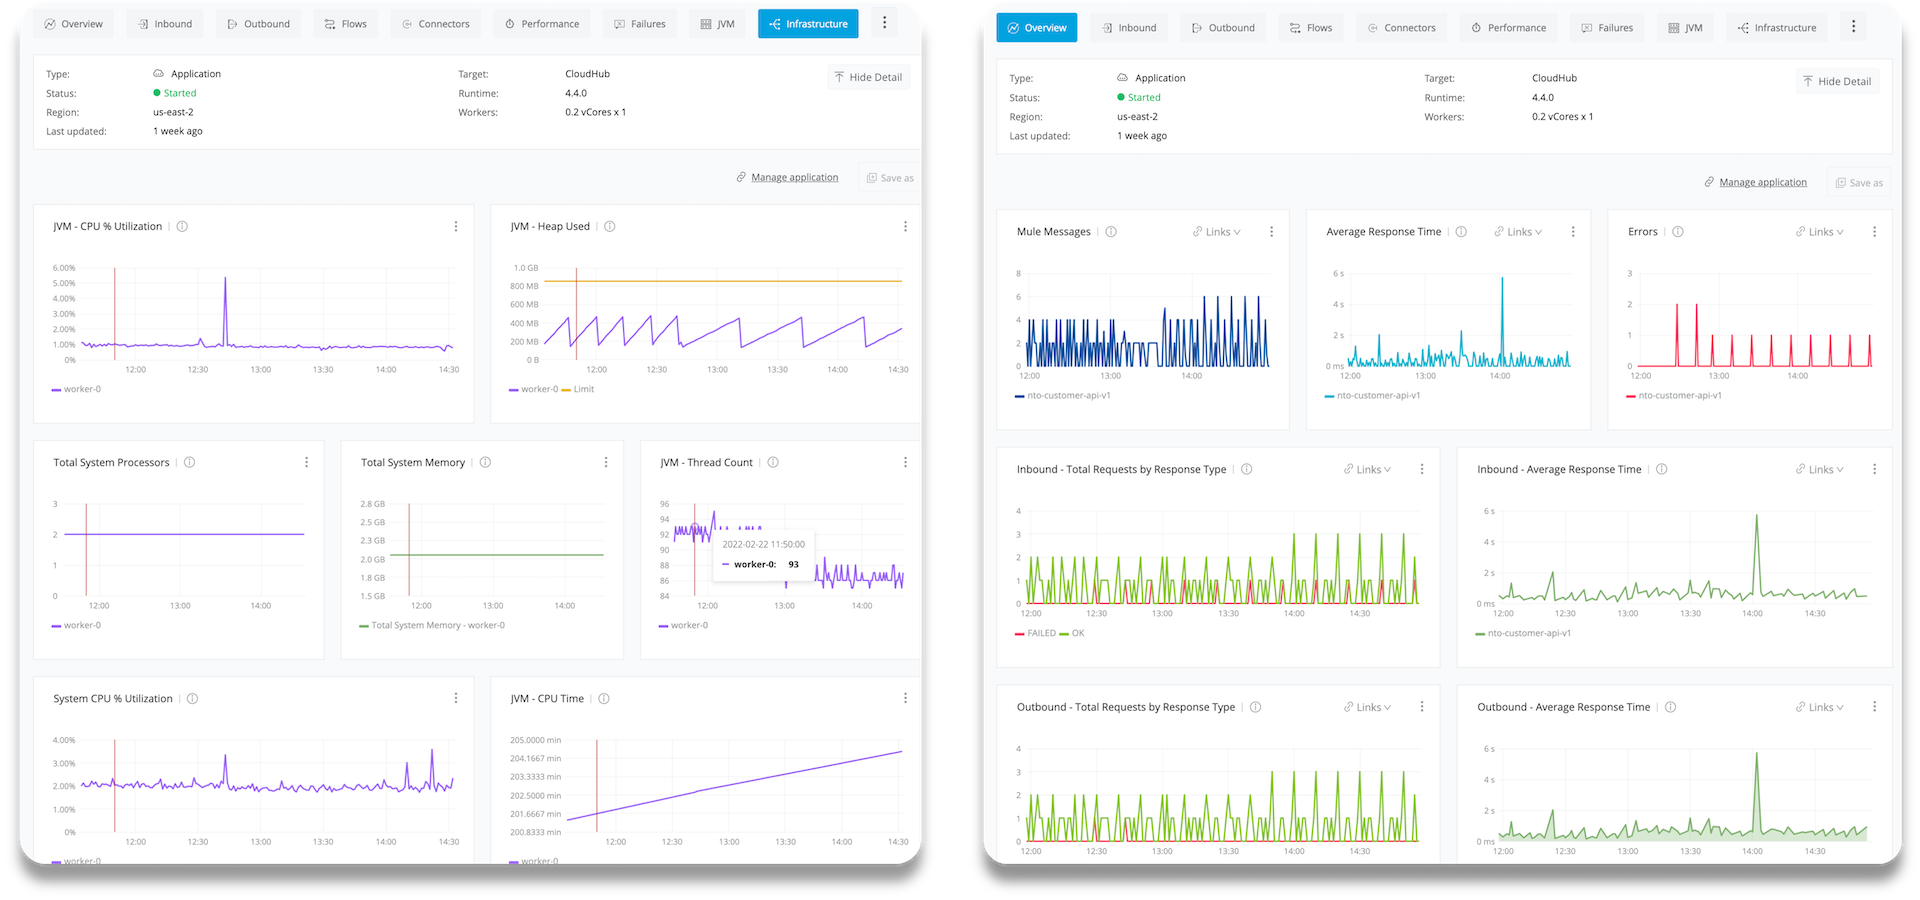
MuleSoft has traditionally been a very strong player in two aspects of the Observability Trinity - Metrics and Logs. Anypoint Monitoring provides considerable support and functionality for these two observability data sources. However, there has been a gap in the support for tracing (single traces and distributed traces). This limitation within the current offering is the inspiration behind the development of the custom extension.
Together, Anypoint Monitoring and Mule 4 OpenTelemetry Module offer a more comprehensive and robust observability solution and should be part of an enterprise’s overall observability solution.
Observability is NOT Just For Cloud-Native Applications
While there is a great emphasis on observability with regard to cloud-native applications, there are a whole host of legacy applications, using traditional integration patterns which will also benefit tremendously from greater observability. Some of these patterns, shown below in the diagram, include:
-
Batch/ETL
-
File Transfer
-
B2B/EDI
-
P2P APIs
-
Pub/Sub
-
DB-to-DB
-
…
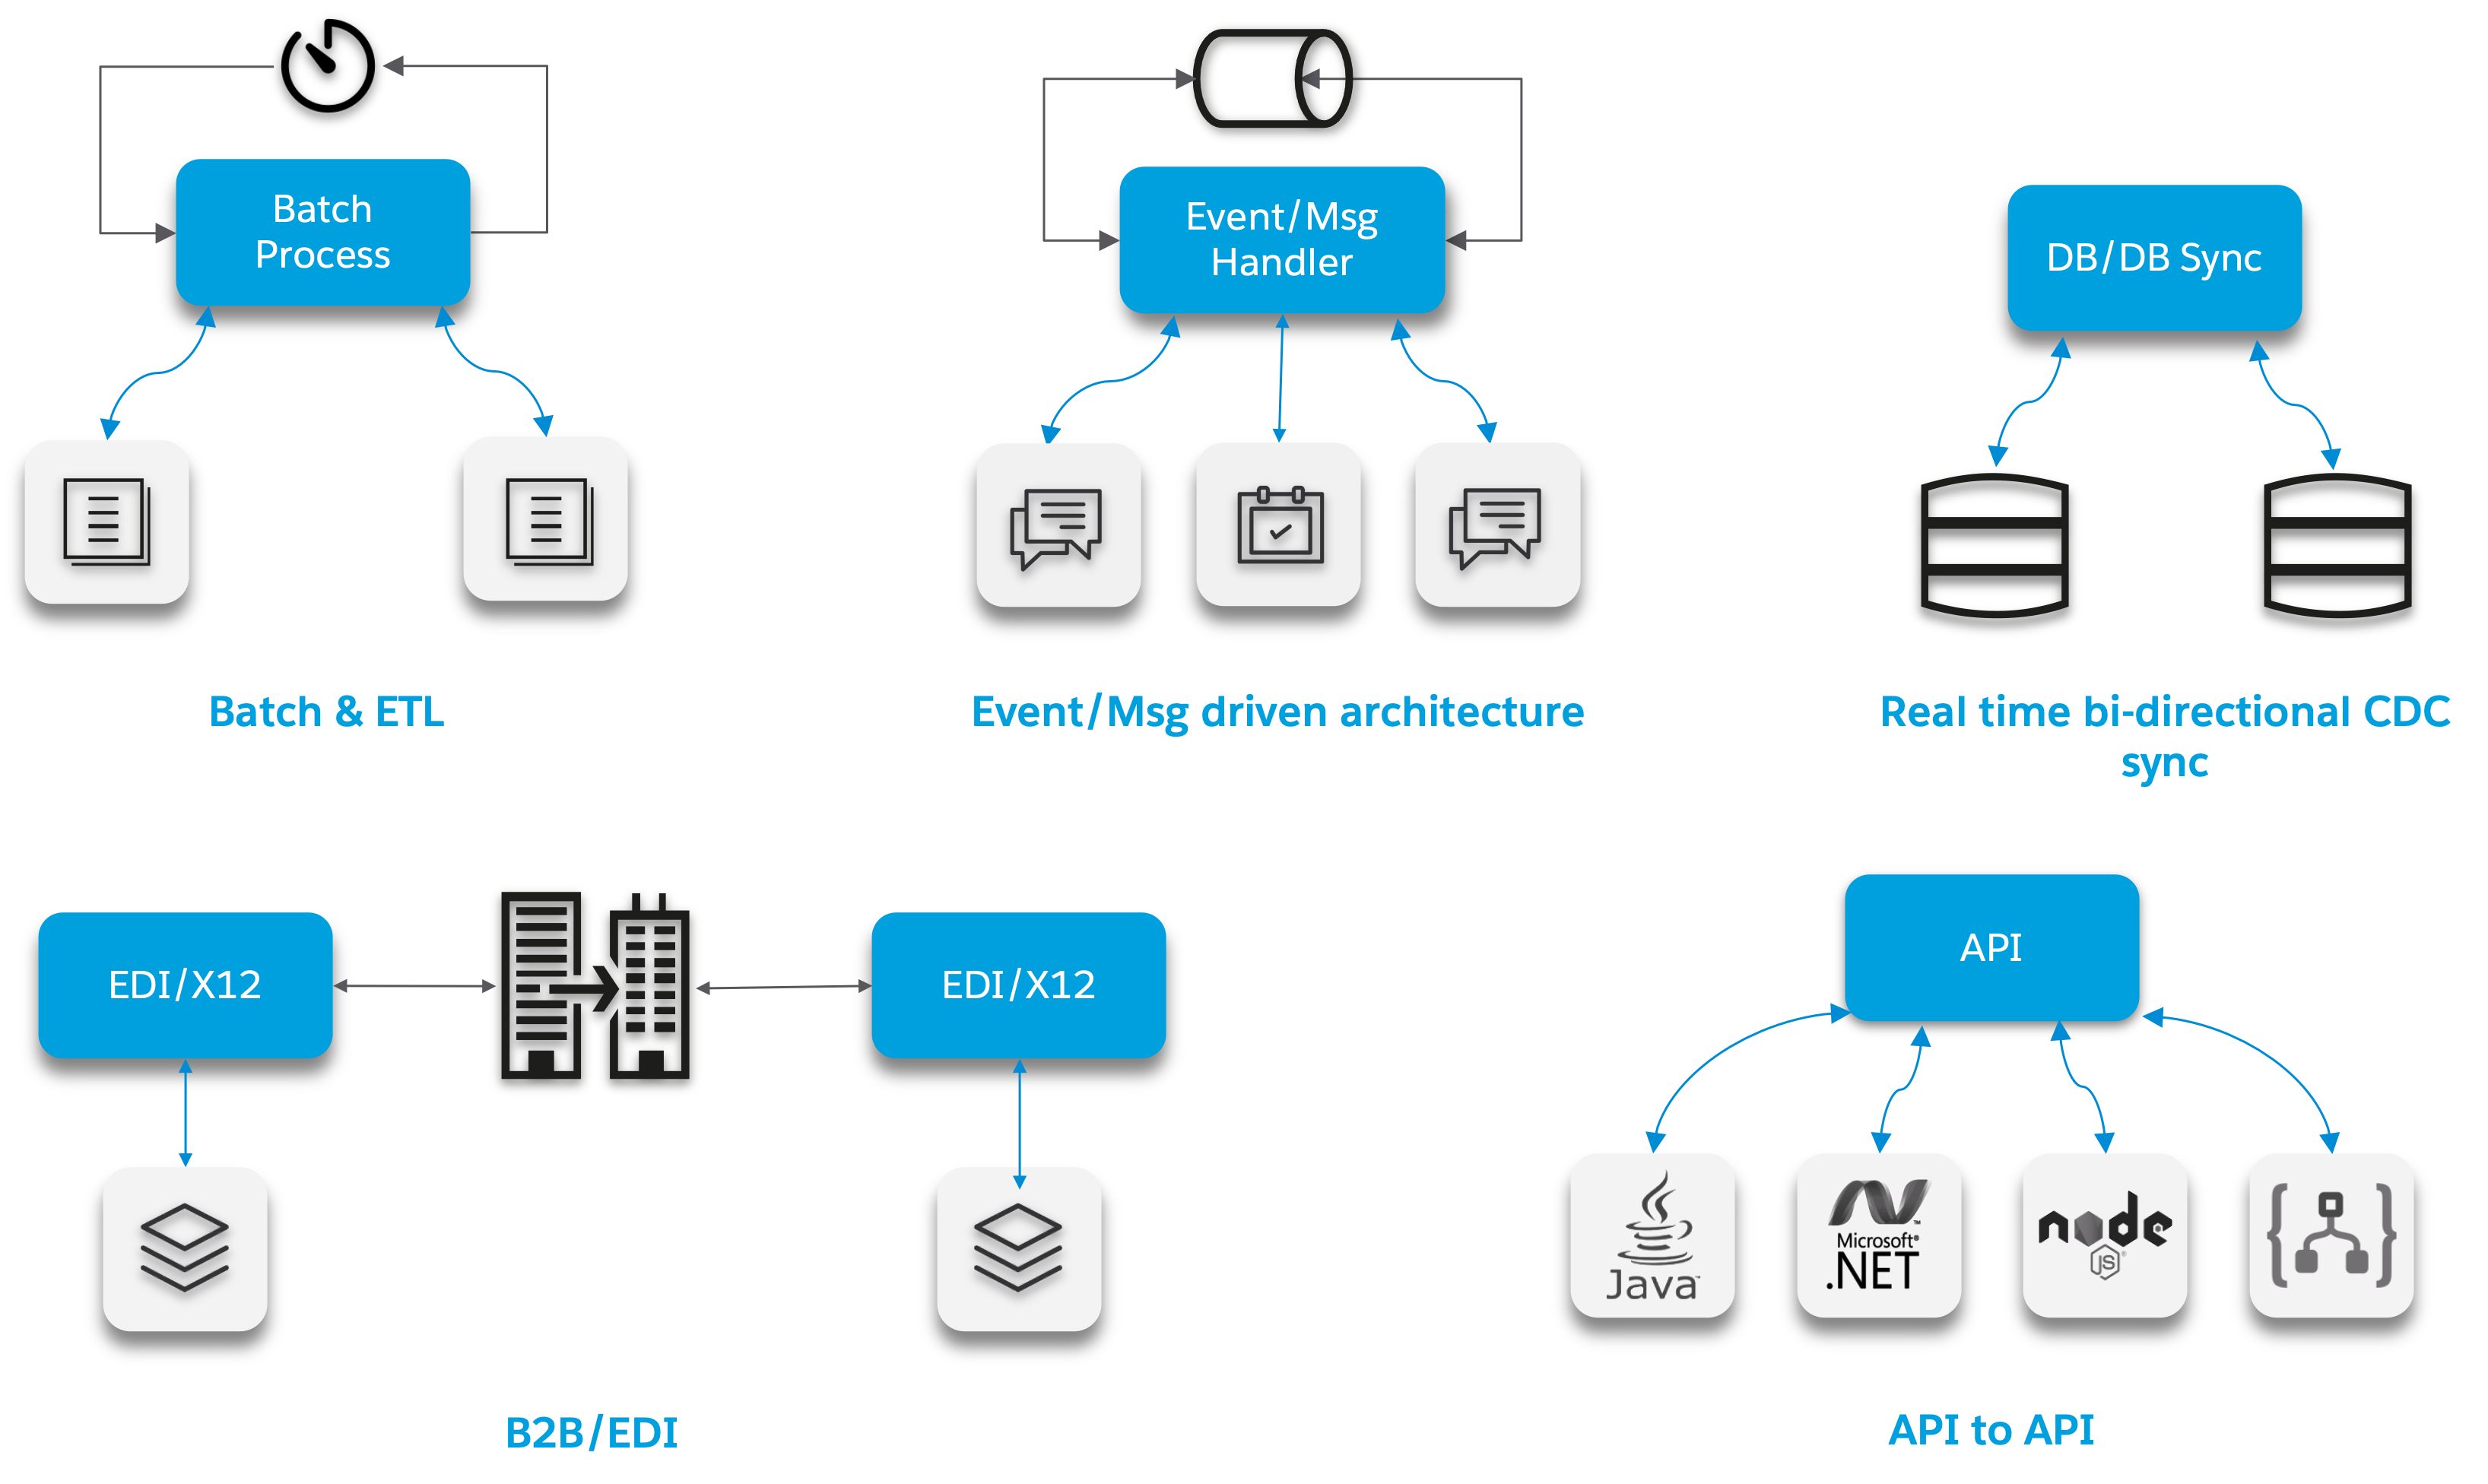
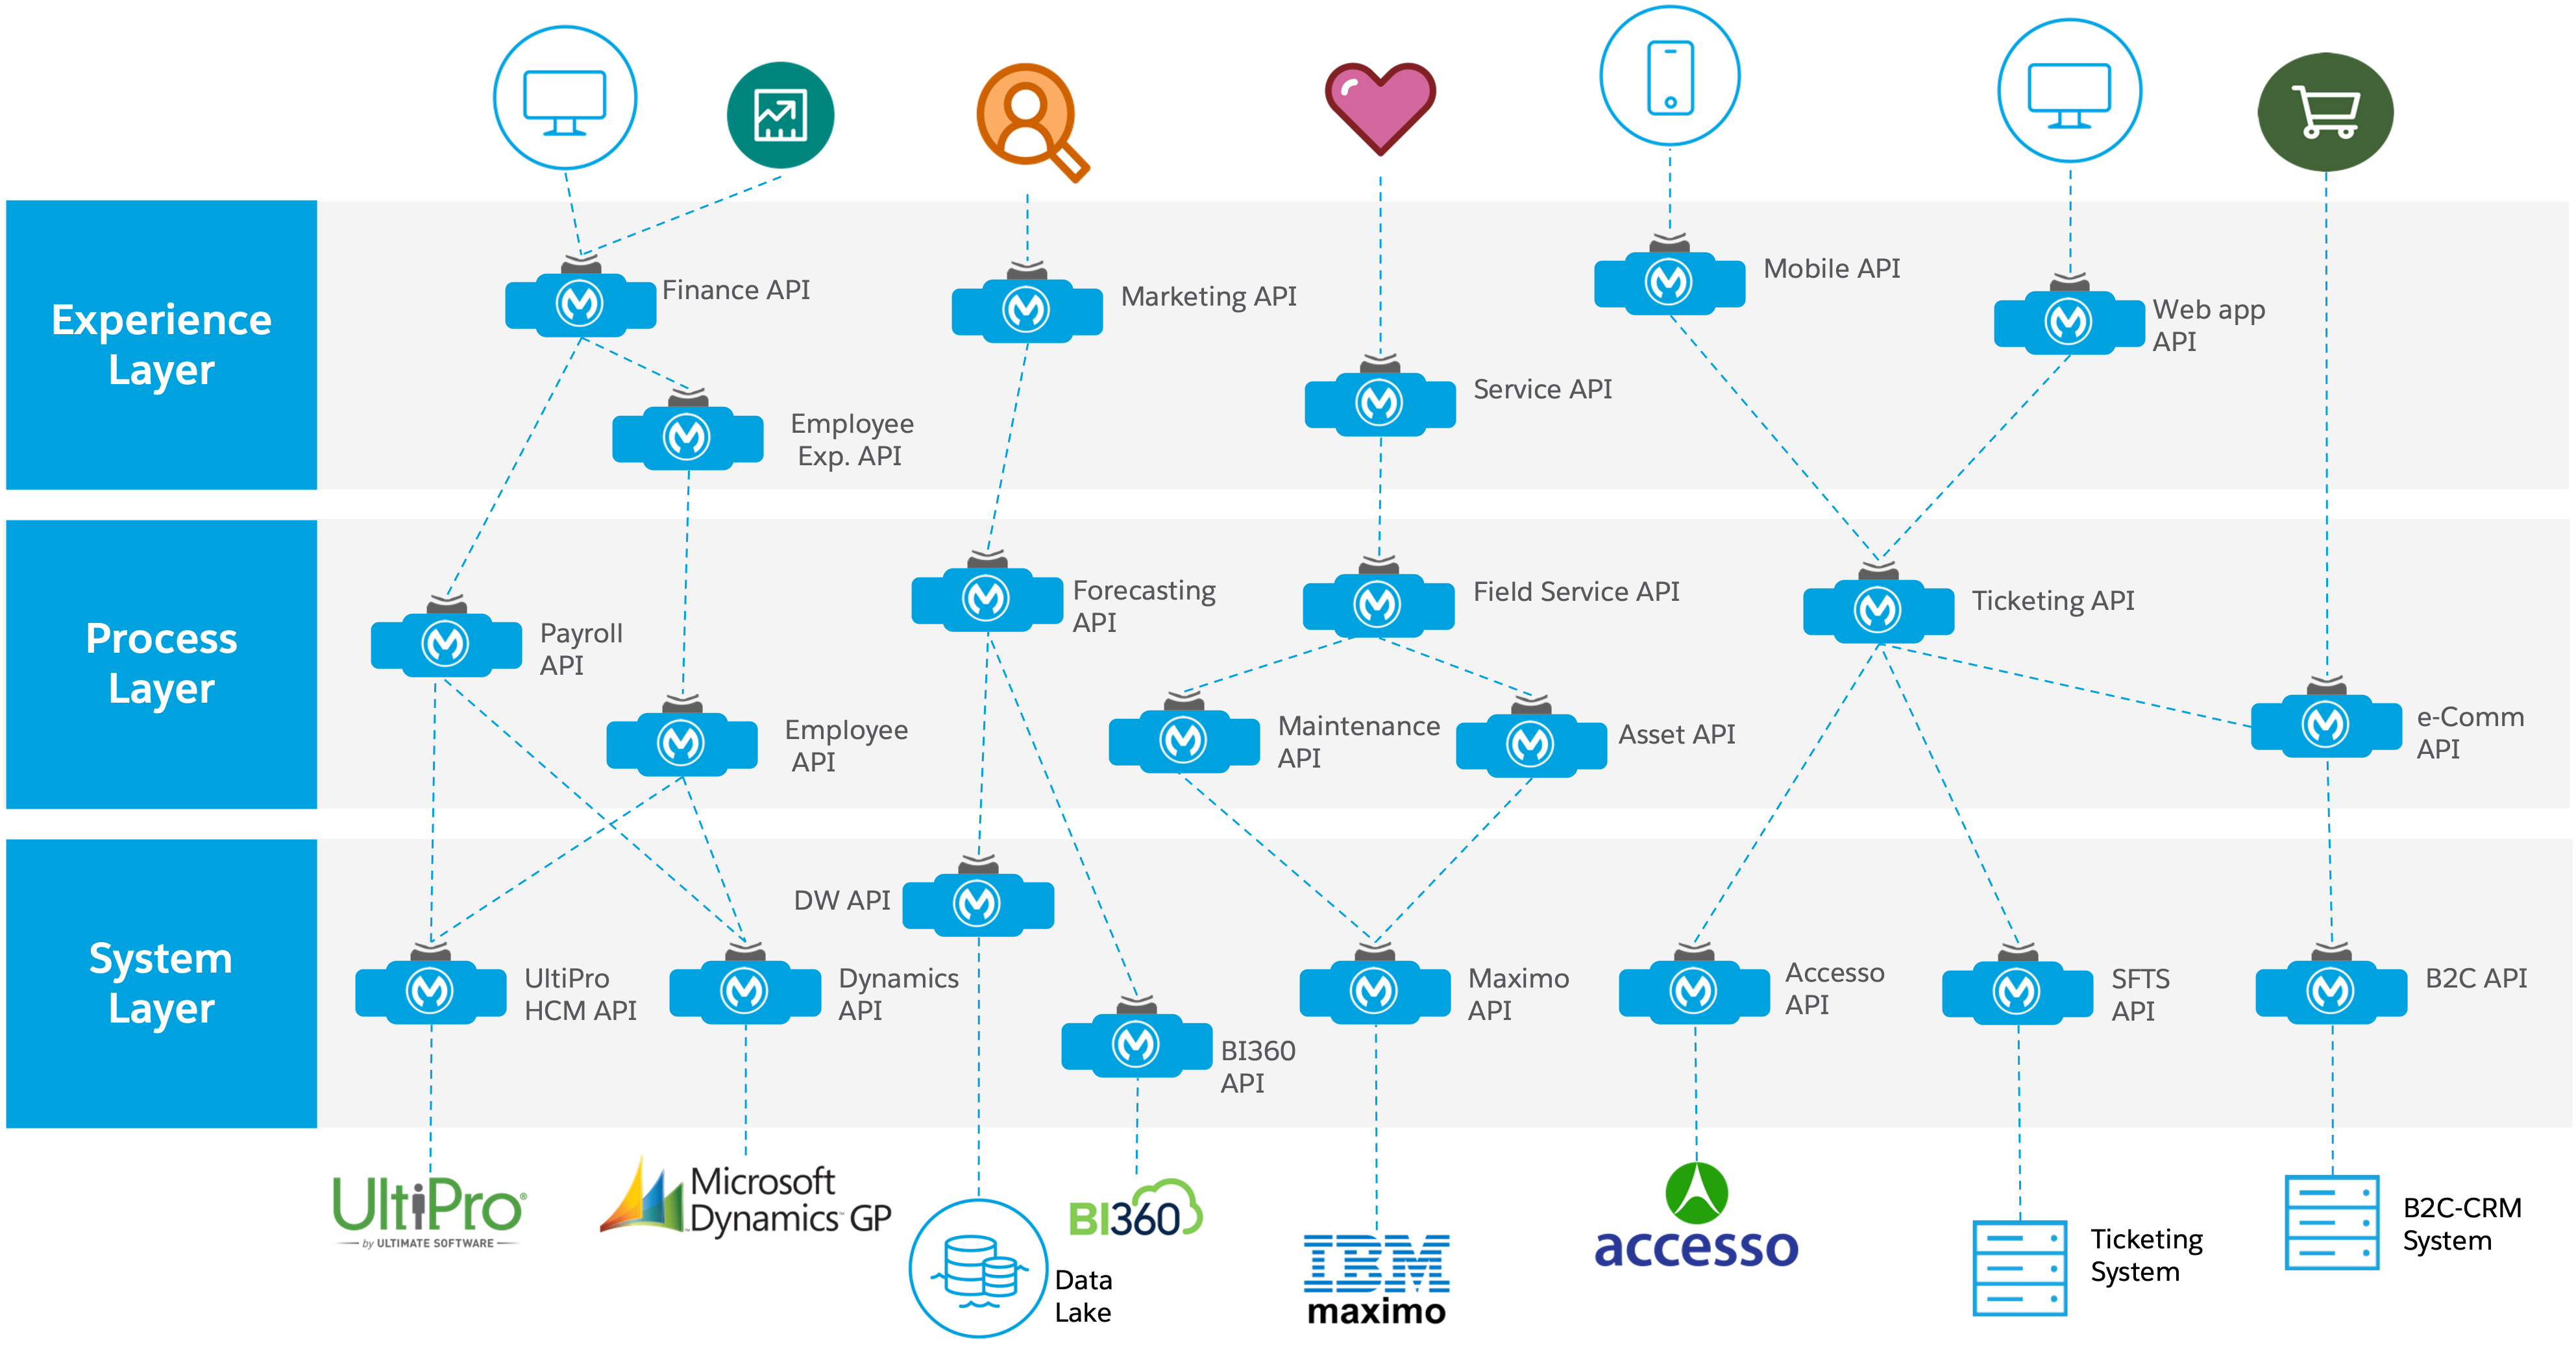
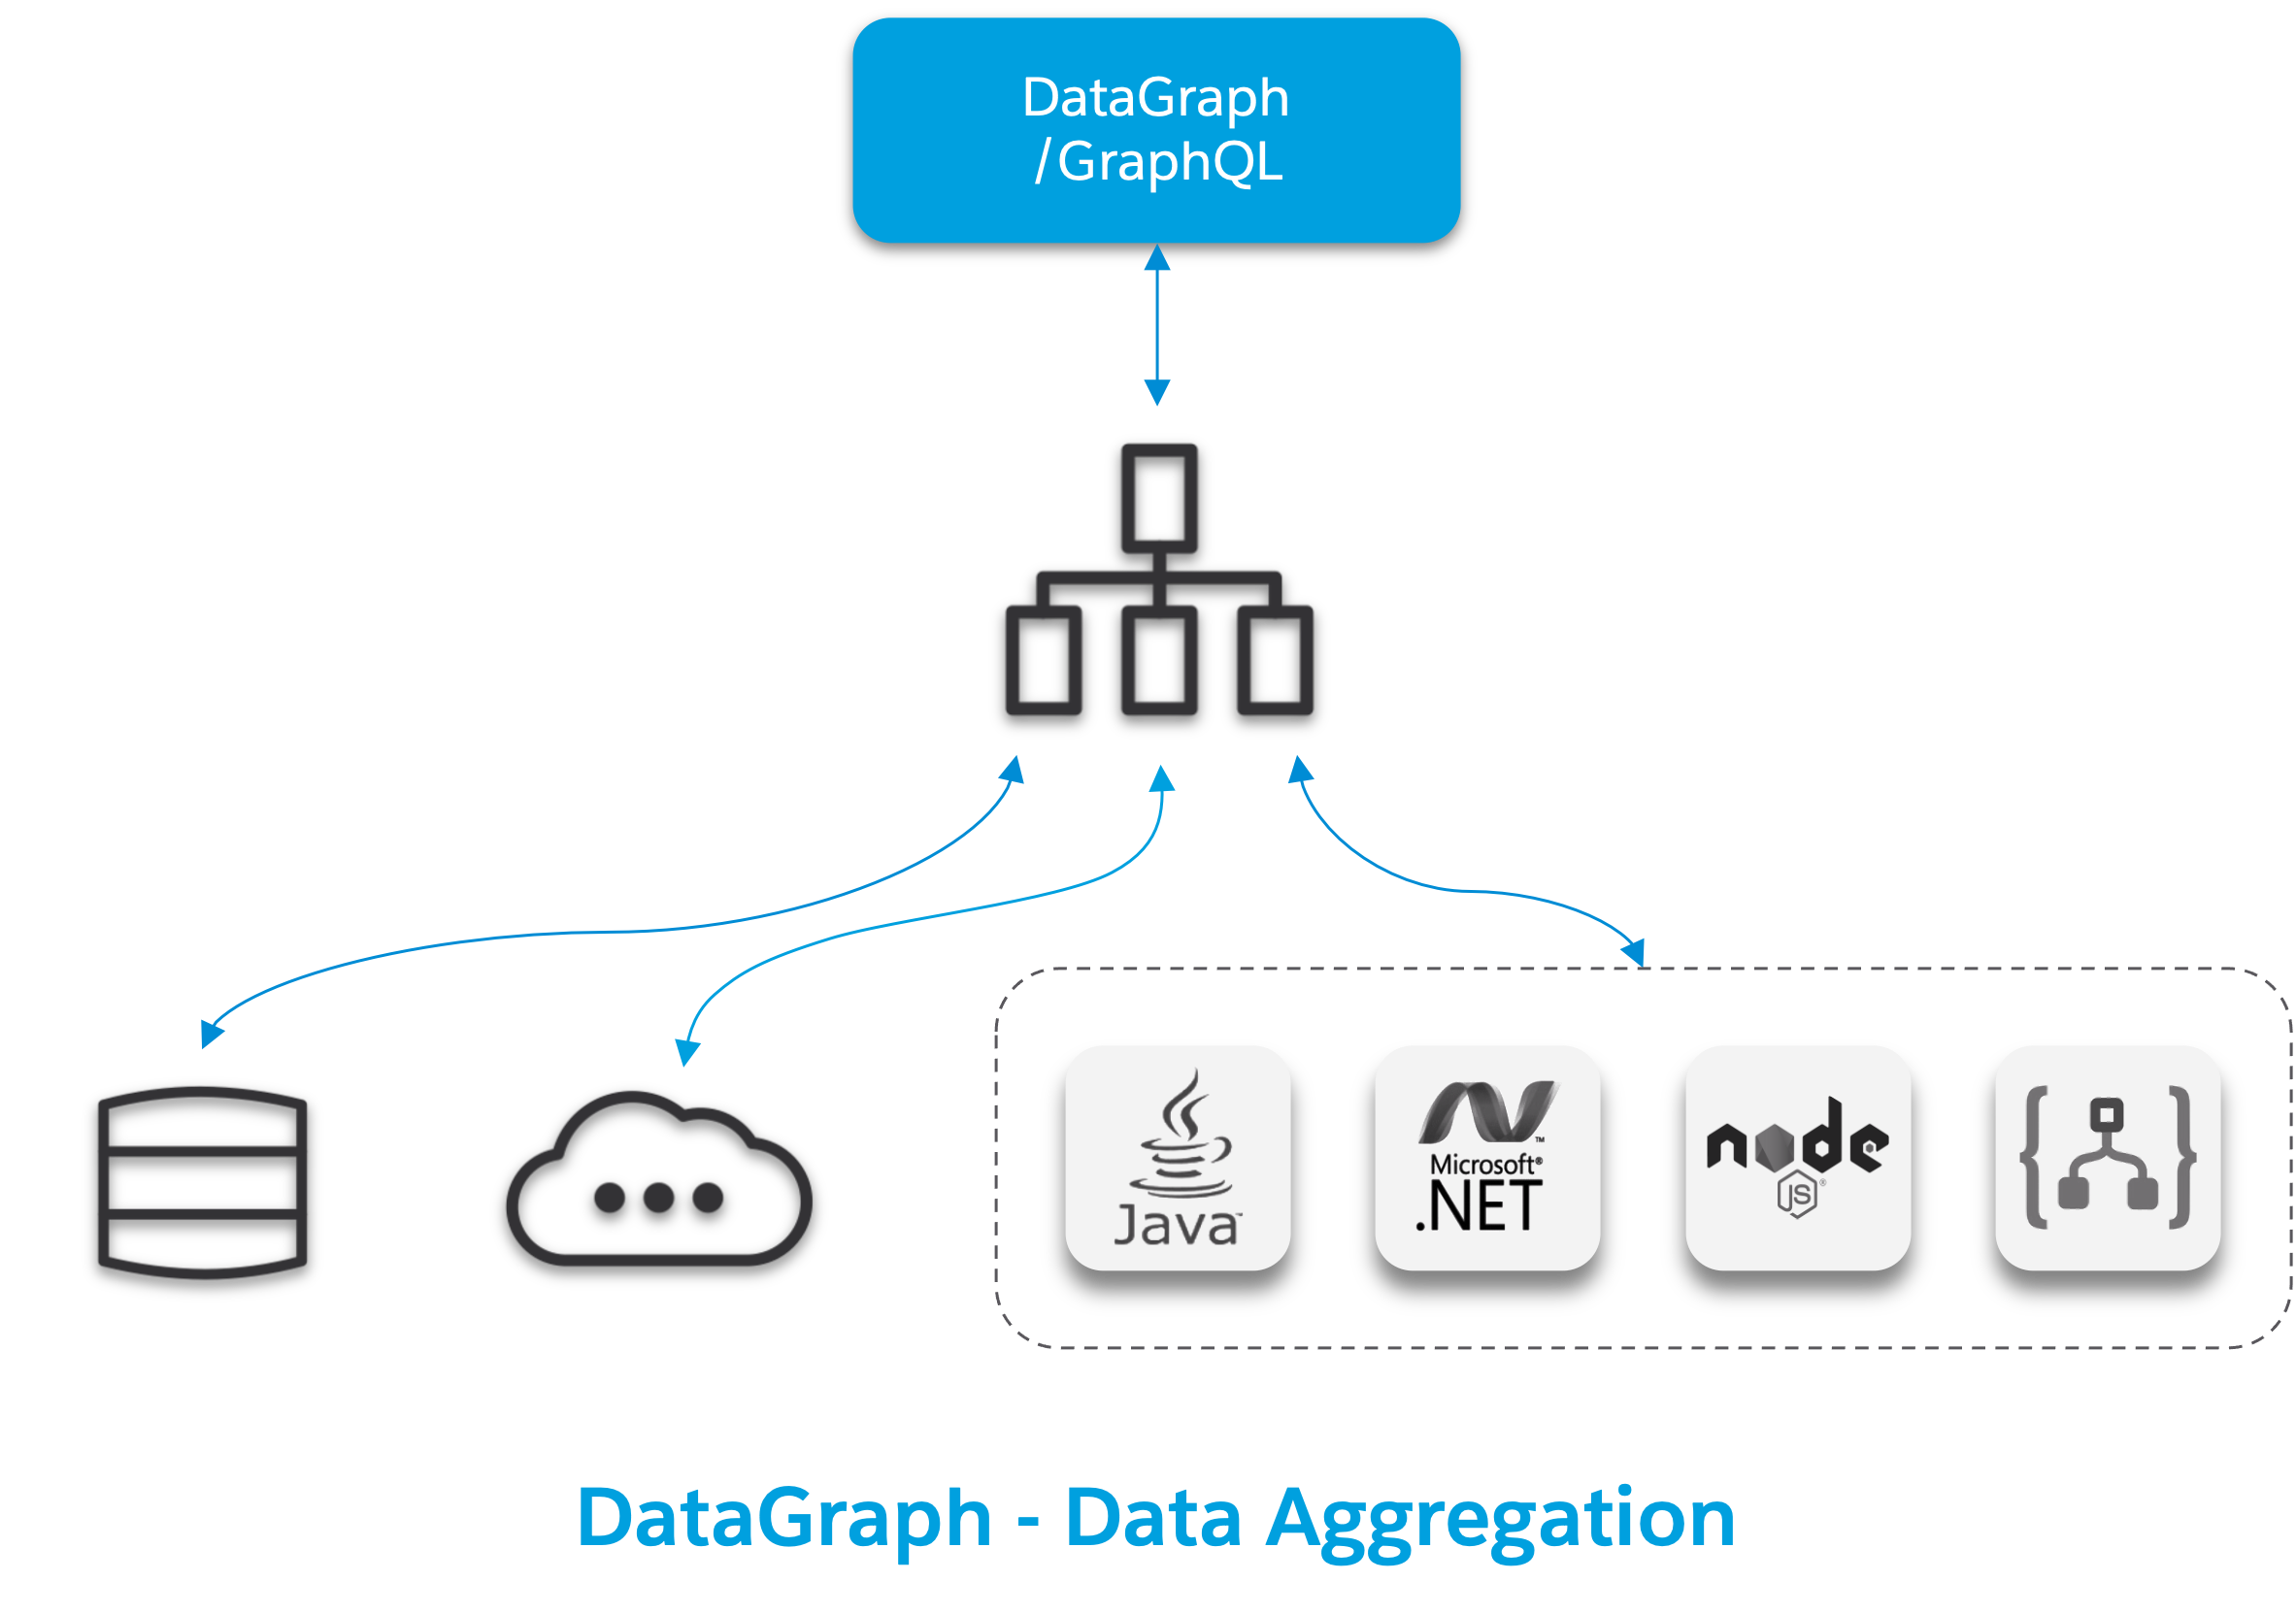
Furthermore, newer API integrations patterns such as GraphQL often implement complicated data aggregation patterns requiring data from multiple, disparate data sources - Databases, SaaS applications, custom APIs, etc., as depicted below. These types of patterns will also be served well from greater observability.
The What on the Mule 4 OpenTelemetry Module
Now that we done a comprehensive walkthrough on the motivation for developing the Mule 4 OpenTelemetry Module custom extension, let’s dig a bit deeper into some of the internals of extension. We’ll start off by diving into the core technology the extension relies upon to accomplish its tasks - OpenTelemetry then discuss the WC3 Trace Context specification and finish off with details on the extension’s architecture.
OpenTelemetry (OTel)
OpenTelemetry is a set of APIs, SDKs, tooling and integrations that are designed for the creation and management of telemetry data such as traces, metrics, and logs. The project provides a vendor-agnostic implementation that can be configured to send telemetry data to the backend(s) of your choice.
https://opentelemetry.io
| OpenTelemetry is not an observability back-end. Instead, it supports exporting data to a variety of open-source (e.g., Jaeger, Prometheus, etc.) and commercial back-ends (e.g., Dynatrace, New Relic, Grafana, etc.). |
As noted above, OpenTelemetry is a framework which provides a single, vendor-agnostic solution with the purpose of standardizing the generation, emittance, collection, processing and exporting of telemetry data in support of observability. OpenTelemetry was established in 2019 as an open source project and is spearheaded by the CloudNative Computing Foundation (CNCF).
|
In 2019, the OpenCensus and OpenTracing projects merged into OpenTelemetry. Currently, OpenTelemetry is at the "incubating" maturity level (up from "sandbox" level a year back) and is one of the most popular projects across the CNCF landscape. |
OpenTelemetry Reference Architecture
Being a CNCF supported project, it’s no surprise the architecture of OpenTelemetry is cloud friendly - which also implies that it is friendly to all distributed environments. While there are various aspects to the overall OpenTelemetry framework (e.g., API, SDK, Signals, Packages, Propagators, Exporters, etc.), the functional architecture is relatively simple with regard to client-side implementations as seen in the diagram below.
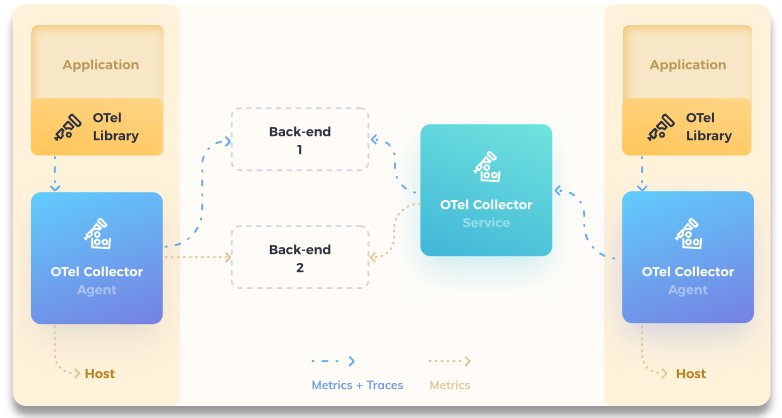
On the client side (e.g., the Mule application), there are really only two OpenTelemetry components which are used and one is optional:
- OpenTelemetry Library
-
-
OpenTelemtry API
-
OpenTelemtry SDK
-
- OpenTelemetry Collector
-
-
[Optional]
-
Below is a brief description of these client-side components.
OpenTelemetry API
The OpenTelemetry API is an abstracted implementation of data types and non-operational methods for generating and correlating tracing, metrics, and logging data. Functional implementations of the API are language specific.
OpenTelemetry SDK
The OpenTelemetry SDK is a language specific implementation (e.g., Java, Ruby, C++, …) of the abstracted OpenTelemetry API. Here is a list of the currently supported languages.
OpenTelemetry Collector
The OpenTelemetry Collector is a vendor-agnostic proxy that can receive, process, and export telemetry data. It supports receiving telemetry data in multiple formats (e.g., OTLP, Jaeger, Prometheus, as well as many commercial/proprietary tools) and sending data to one or more back-ends. It also supports processing and filtering telemetry data before it gets exported.
Vendor Support for OpenTelemetry
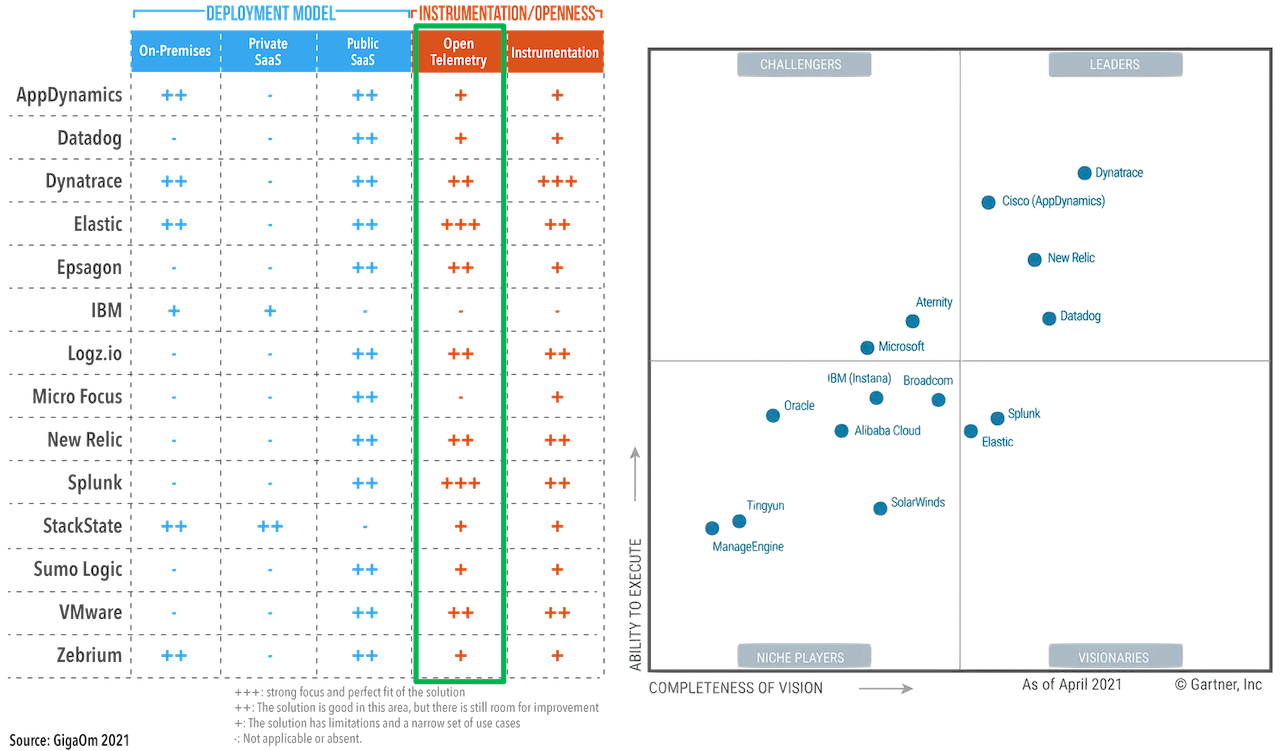
As shown in the graphic below, a 2021 GigaOm study concluded that top tier cloud providers are moving to embrace OpenTelemetry quickly and observability vendors are likewise offering integration with OpenTelemetry tools, albeit, at various levels. However, it should be of no surprise the Gartner "visionaries" are offering the greatest level of support.
The GigaOm study also reveals full adoption of the OpenTelemetry standards can yield significant benefits around instrumentation, as customers can deploy drop-in instrumentation regardless of the platform. Furthermore, portability becomes achievable as well, improving both cost savings and efficiency.
WC3 Trace Context
The Mule 4 OpenTelemetry Module supports the WC3 Trace Context format as a mechanism for context propagation.
Trace Context
The WC3 Trace Context specification defines a universally agreed-upon format for the exchange of trace context propagation data - referred to as trace context. Trace context solves the problems typically associated with distributed tracing by:
-
Providing a unique identifier for individual traces and requests, allowing trace data of multiple providers to be linked together.
-
Providing an agreed-upon mechanism to forward vendor-specific trace data and avoid broken traces when multiple tracing tools participate in a single transaction.
-
Providing an industry standard that intermediaries, platforms, and hardware providers can support.
Trace Context Headers
Trace context is split into two individual propagation fields supporting interoperability and vendor-specific extensibility:
traceparentDescribes the position of the incoming request in its trace graph in a portable, fixed-length format. Every tracing tool MUST properly
set traceparent even when it only relies on vendor-specific information in tracestate
tracestateExtends traceparent with vendor-specific data represented by a set of name/value pairs. Storing information in tracestate is optional.
Tracing tools can provide two levels of compliant behavior interacting with trace context:
-
At a minimum they MUST propagate the
traceparentandtracestateheaders and guarantee traces are not broken. This behavior is also referred to as forwarding a trace. -
In addition they MAY also choose to participate in a trace by modifying the
traceparentheader and relevant parts of thetracestateheader containing their proprietary information. This is also referred to as participating in a trace.
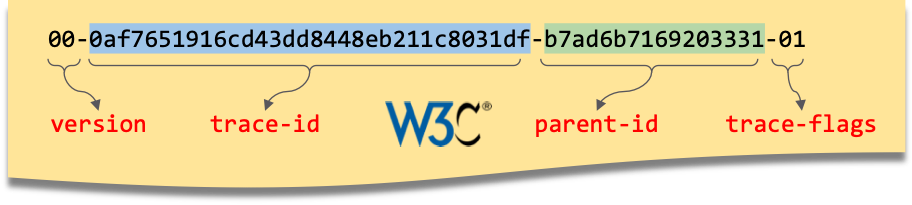
traceparent HTTP Header Details
The traceparent header represents the incoming request in a tracing system in a common format, understood by all vendors.
The header has 4 constituent parts, where each part is separated by a -:
-
version- header version; currently the version number is00 -
trace-id- is the unique 16-byte ID of a distributed trace through a system. -
parent-id- is the 8-byte ID of this request as known by the caller (sometimes known as thespan-id, where a span is the execution of a client request). Theparent-idis automatically generated by the OpenTelemetry SDK. -
trace-flags- tracing control flags; current version (00) only supports thesampledflag (01)
traceparent HTTP Header tracestate HTTP Header Details
Since the tracestate header is optional, it will not be discussed any further in this document. See
WC3: Tracestate Header for additional details on the header.
MuleSoft OpenTelemetry Module
As mentioned earlier, the primary purpose of the Mule 4 OpenTelemetry Module extension is to facilitate the participation of Mule applications in distributed tracing activities. To accomplish its goal, the extension relies upon three primary frameworks:
-
MuleSoft Java SDK
-
MuleSoft Server Notifications
-
OpenTelemetry Framework
MuleSoft Java SDK
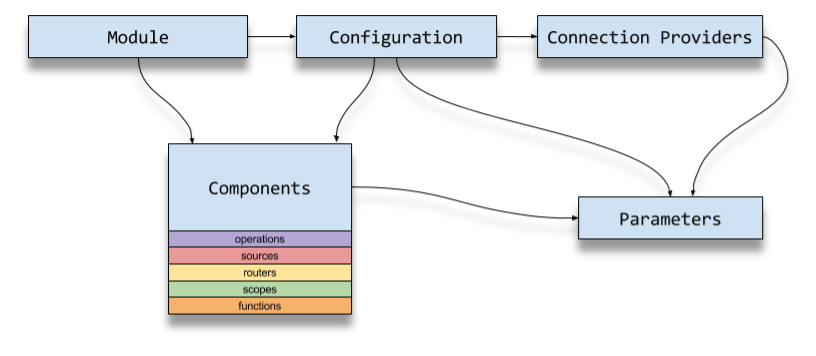
In Mule 4, extending the product is done by developing custom extensions via a MuleSoft furnished Java SDK. The comprehensive framework allows external developers to build add-on functionality in the same manner as Mule engineers build Mule supplied components and connectors. While we won’t get into the details of the framework or how to develop a custom extension, the graphic below depicts the basic structure of an extension based on the Module Model.
MuleSoft Server Notifications
Mule provides an internal notification mechanism
that can be used to access changes which occur on the Mule Server, such as adding a flow component, the start or end of a message processor, a
failing authorization request and many other changes.
These notifications can be subscribed to by "listeners" either programmatically or by using the <notifications> element in a Mule
configuration file.
  1
2
3
4
5
6
7
8
9
10
11
12
13
14
15
16

  import com.avioconsulting.mule.opentelemetry.internal.notifications.listeners.MuleMessageProcessorNotificationListener;
import com.avioconsulting.mule.opentelemetry.internal.notifications.listeners.MulePipelineMessageNotificationListener;
import org.mule.runtime.api.notification.NotificationListenerRegistry;
import javax.inject.Inject;

public class RegisterNotificationListeners
{
    @Inject
    NotificationListenerRegistry notificationListenerRegistry;

    RegisterNotificationListeners()
    {
        notificationListenerRegistry.registerListener(new MuleMessageProcessorNotificationListener());
        notificationListenerRegistry.registerListener(new MulePipelineMessageNotificationListener());
    }
}
<notification> element
  1
2
3
4
5
6
7
8
9
10
11
12
13
14

  <object doc:name="Object"
        name="_mulePipelineNotificationListener"
        class="com.avioconsulting.mule.opentelemetry.internal.notifications.listeners.MulePipelineMessageNotificationListener" />

<object doc:name="Object"
        name="_muleMessageProcessorNotificationListener"
        class="com.avioconsulting.mule.opentelemetry.internal.notifications.listeners.MulePipelineMessageNotificationListener" />

<notifications>
    <notification event="PIPELINE-MESSAGE"/>
    <notification event="MESSAGE-PROCESSOR"/>
    <notification-listener ref="_muleMessageProcessorNotificationListener"/>
    <notification-listener ref="_mulePipelineNotificationListener"/>
</notifications>
The agent takes advantage of the notification framework and in particular relies upon these two notification interfaces:
-
PipelineMessageNotificationListener-
Start and End of a flow
-
-
MessageProcessorNotificationListener-
Start and End of a message processor
-
OpenTelemetry Framework
The Mule 4 OpenTelemetry Module leverages the OpenTelemetry Java implementation to generate, batch
and export trace data to any OpenTelemetry compliant Collector.
Specifically, the agent builds on top of the opentelemetry-java package for
manual instrumentation of Mule applications. By taking full advantage of the OTel
Java implementation, the Mule extension becomes completely stand-alone and does not require any additional OpenTelemetry components to be a
participant in a distributed trace.
Mule 4 OpenTelemetry Module Architecture
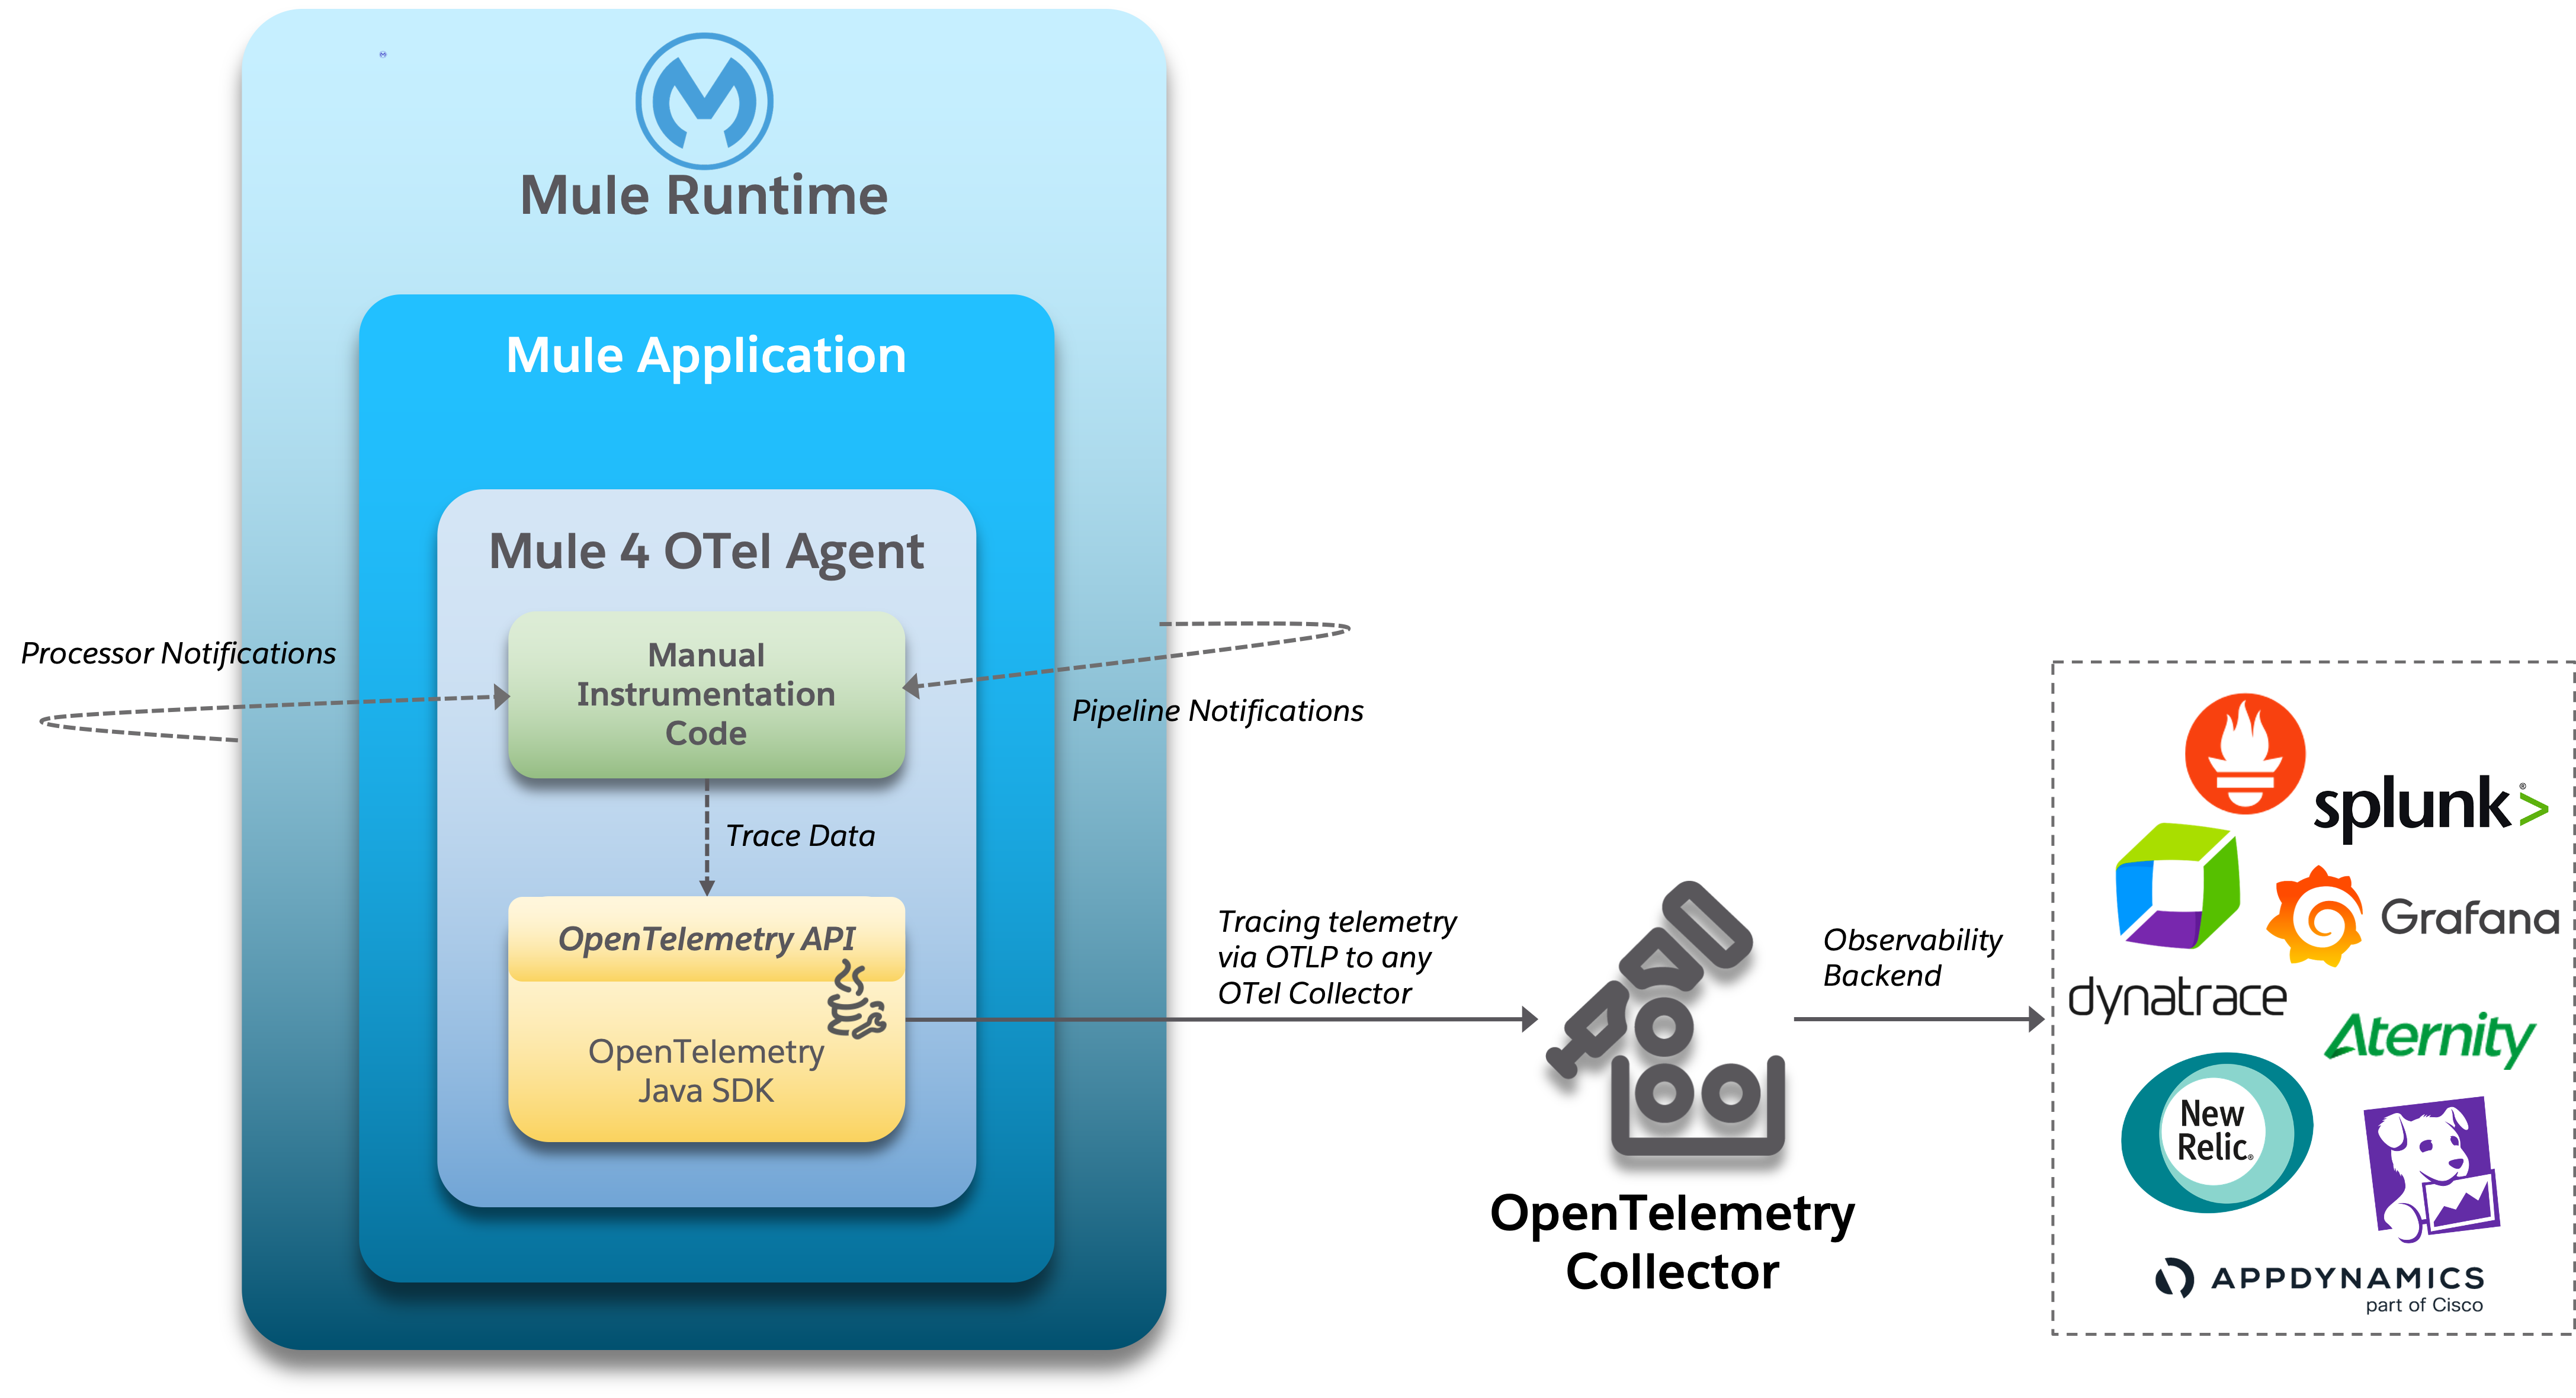
The architecture of the Mule 4 OpenTelemetry Module is relatively straight forward. As depicted in the diagram below, the agent is comprised of code which listens for notification events from the Mule runtime. During the processing of the notification, the agent generates metadata about the notification and sends that data to the OpenTelemetry SDK via the OpenTelemetry API - shown as Trace Data in the diagram. The OpenTelemetry SDK continues to gather the extension generated trace data until all processing is complete. At that point, the OpenTelemetry SDK exports the trace data using the configured Exporter, e.g. the OpenTelemetry wire Protocol (OTLP) Exporter, to an OpenTelemetry Collector.
Mule Trace
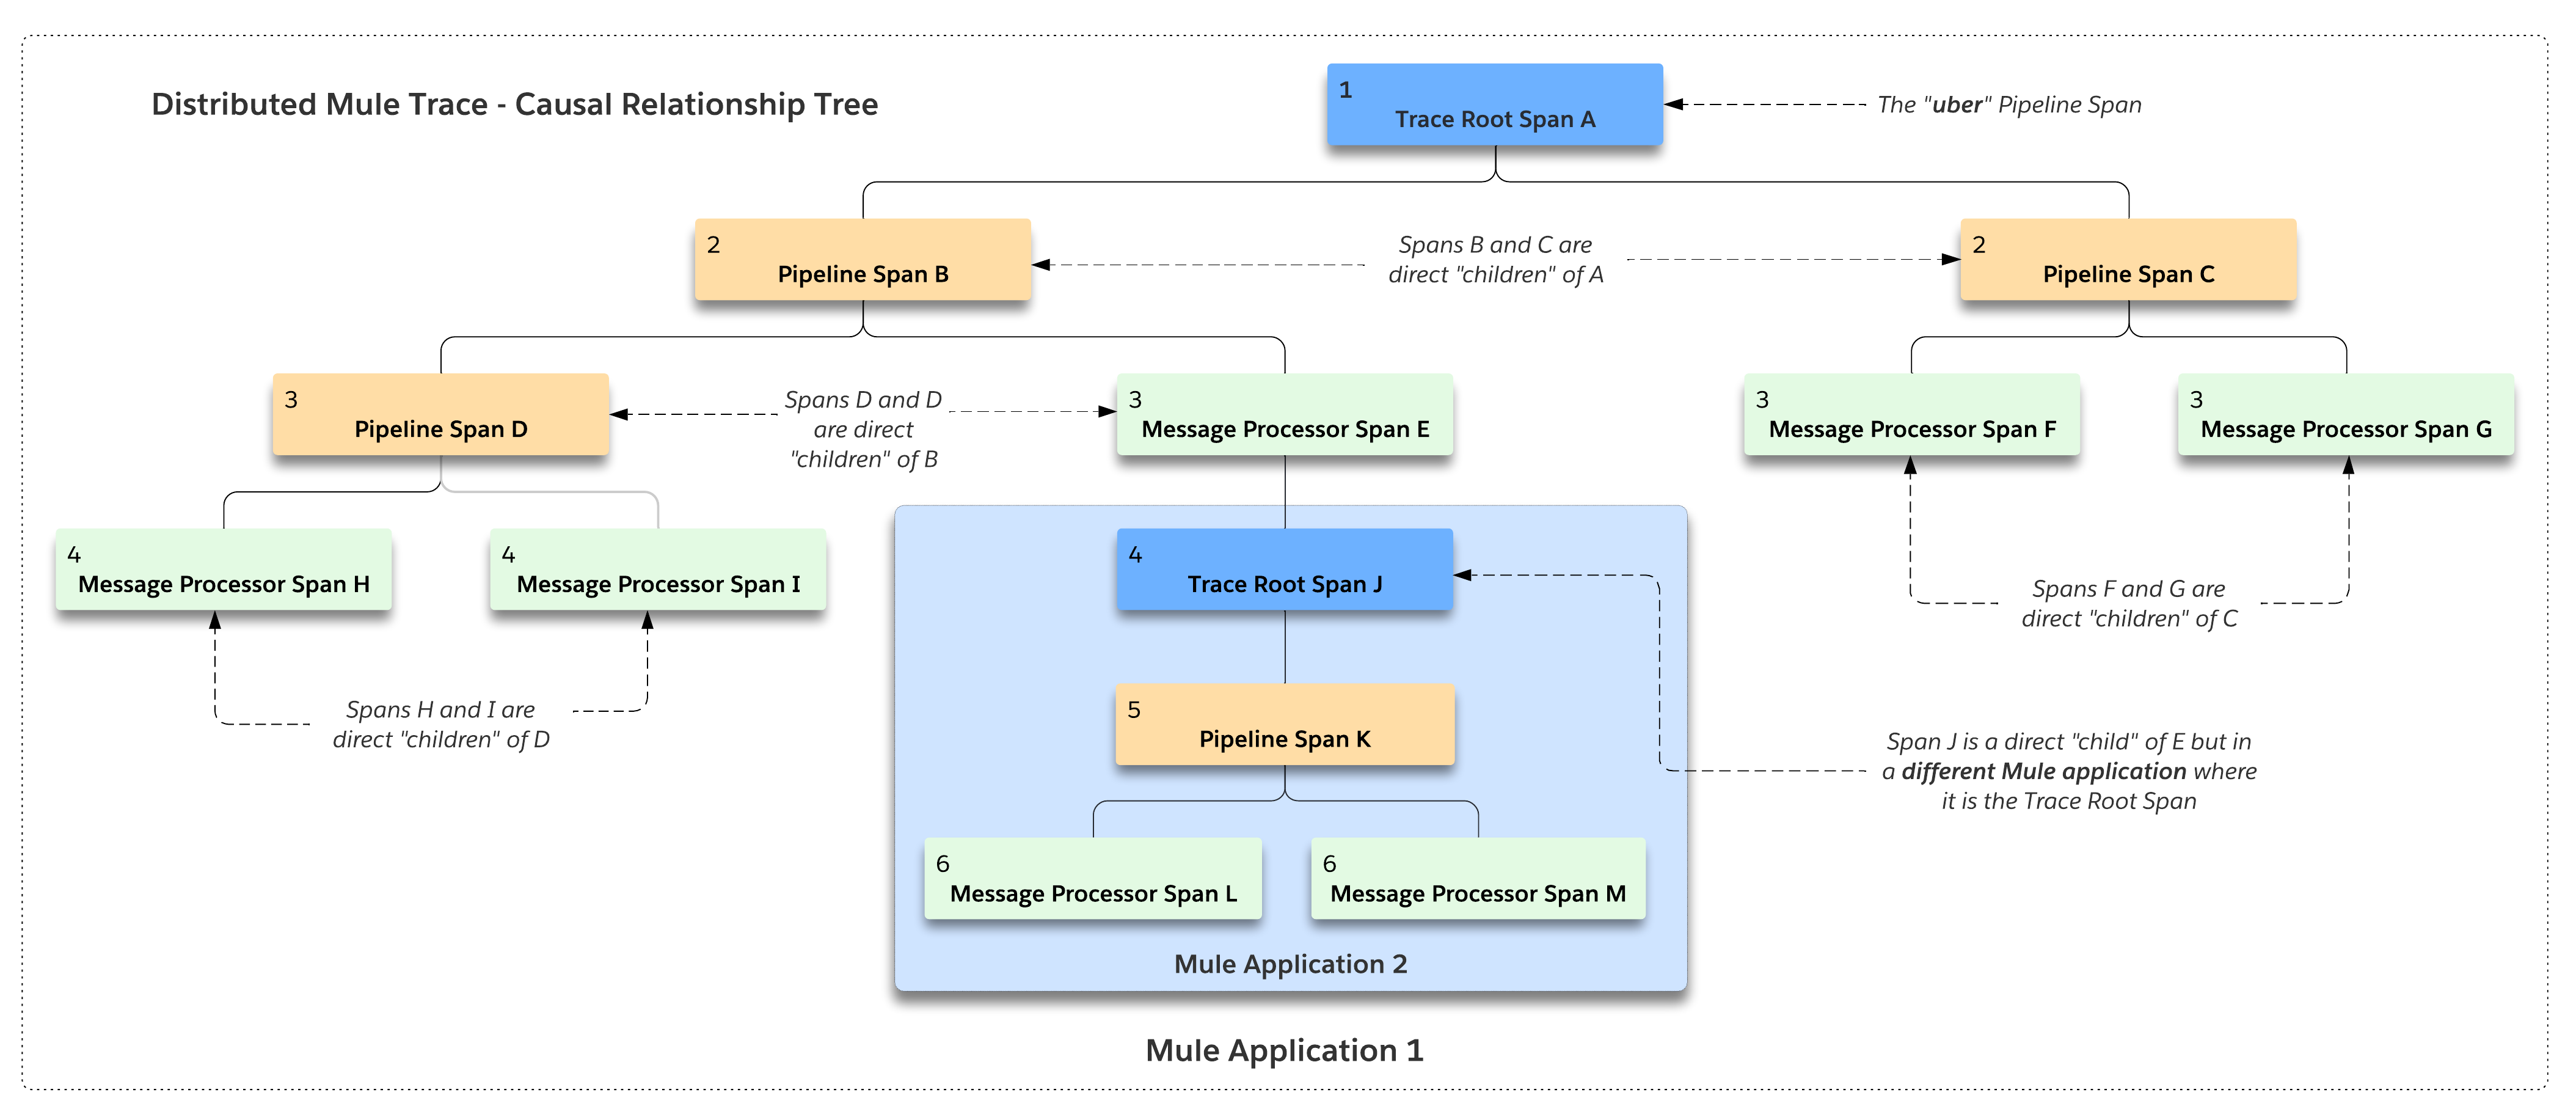
The figure below shows the causal (parent/child) relationship between nodes in a Mule Trace that crosses two separate Mule applications. As can be seen, the hierarchy can become quite complex and nested. Luckily, the OpenTelemetry SDK manages most of that complexity for us.
- Mule Trace
-
A Mule Trace is simply a collection of OTel Spans structured hierarchically . A trace has just one trace root span and one or more child spans - Pipeline Spans and/or Message Processor Spans.
- Trace Root Span
-
A Root Span is an OTel Span which serves as the root node in a Mule trace. It is associated with the initial Mule Flow. In reality it is also a pipeline span.
- Pipeline Span
-
A Pipeline Span is an OTel Span which is associated with Mule subflows and/or flow references.
- Message Processor Span
-
A Message Processor Span is an OTel Span which is associated with Mule message processors.
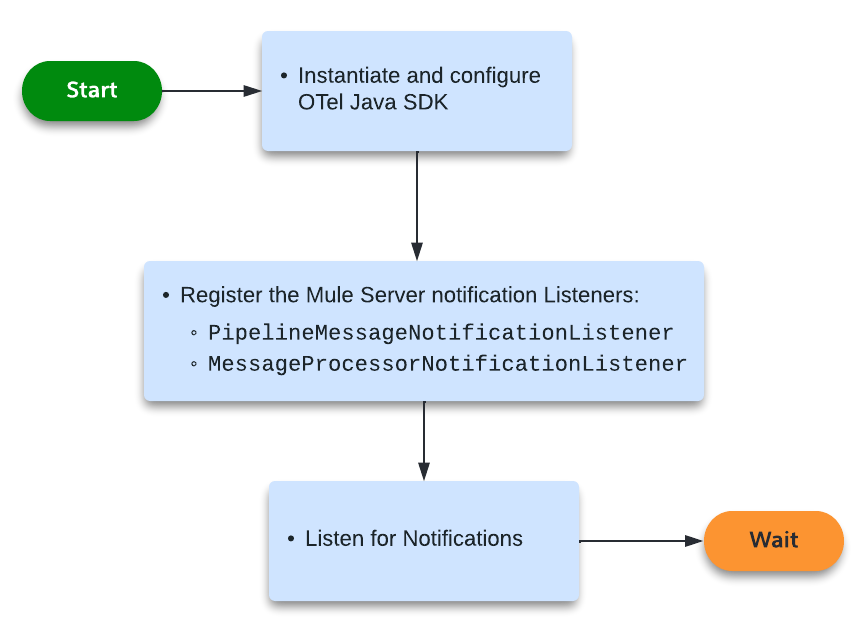
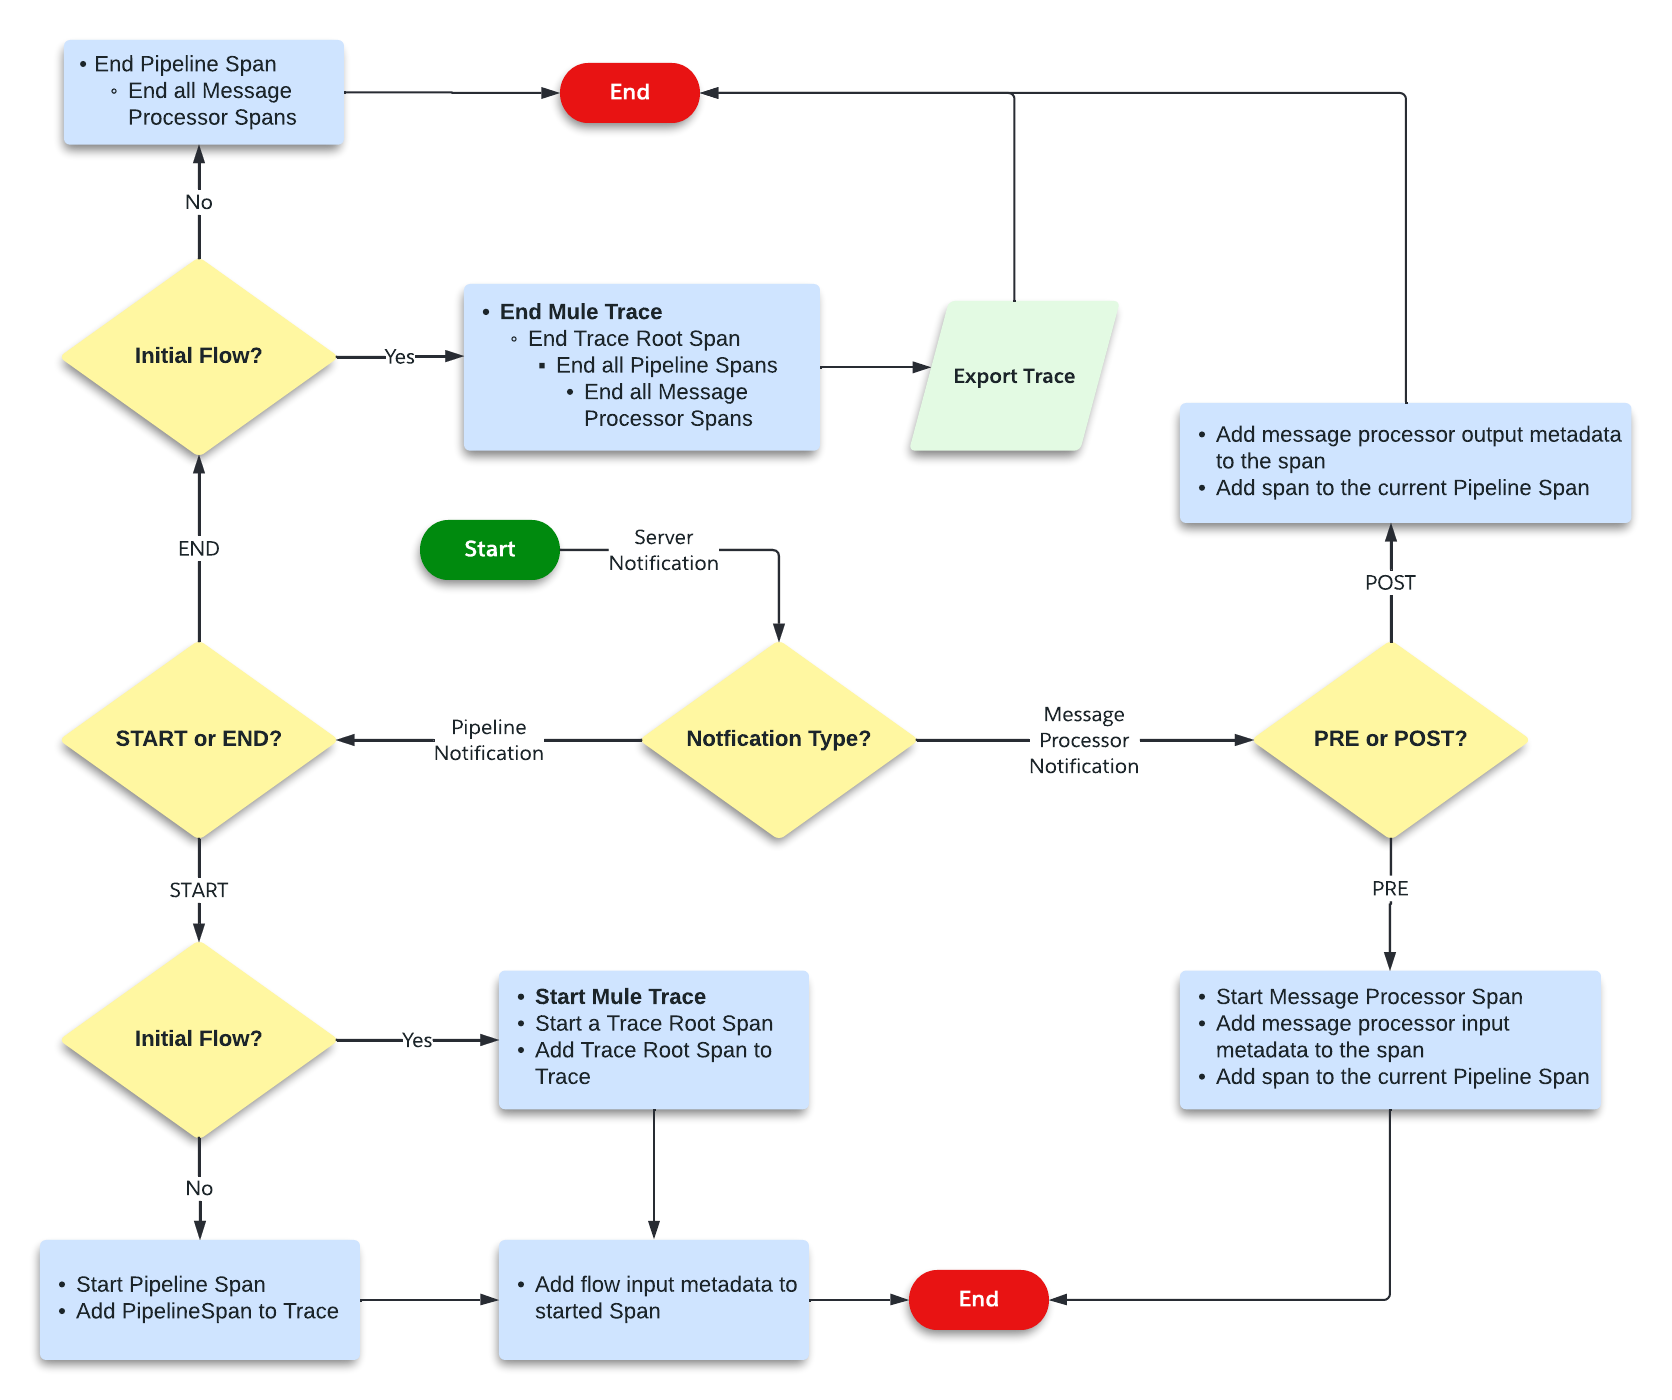
High-Level Agent Functionality
The two flowcharts below detail at high-level the functionality of the extension.
Startup
Notification Processing
The How on the Mule 4 OpenTelemetry Module
Installation
To use this extension, add following dependency to your mule application project.
    <dependency>
      <groupId>com.avioconsulting.mule</groupId>
      <artifactId>mule-opentelemetry-module</artifactId>
      <version>${mule-opentelemetry-module-version}</version> (1)
      <classifier>mule-plugin</classifier>
</dependency>| 1 | The latest version of the module as published on Maven Central. |
Dependency group id for 1.x is com.avioconsulting, while for 2.x is com.avioconsulting.mule.
|
| This module supports OpenTelemetry Traces. Logs are not supported, yet. |
Auto Configuration
Extension uses OpenTelemetry SDK v1.32.0 in its autoconfigured mode. In this mode, SDK will configure itself based on the environment variables. Supported environment variable details can be seen on open-telemetry/opentelemetry-java.
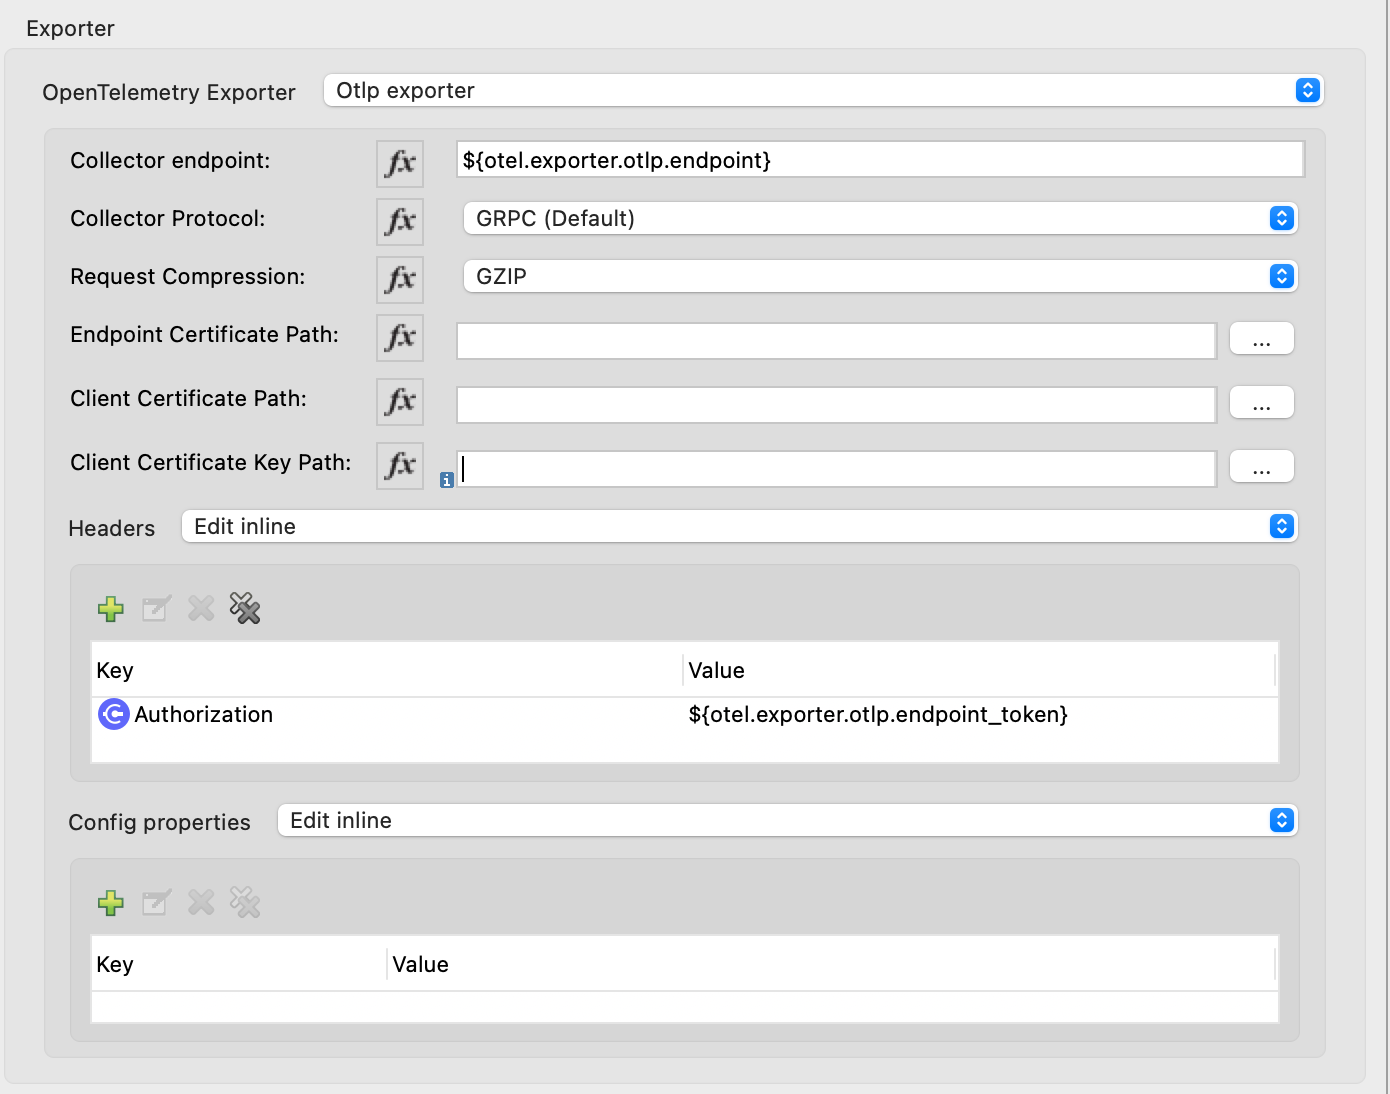
Extension Configuration
Extension allows to configure some resource and exporter attributes at individual application level. This configuration is minimal required to successfully send traces to OpenTelemetry collector.
Following example shows an OpenTelemetry Config with OTLP Exporter configured -
<opentelemetry:config name="OpenTelemetry_Config" doc:name="OpenTelemetry Config" doc:id="91477cb5-36f7-48ad-90b7-c339af87b408" serviceName="api-app-1">
    <opentelemetry:exporter >
        <opentelemetry:otlp-exporter collectorEndpoint="http://localhost:55681/v1" protocol="HTTP_PROTOBUF" requestCompression="GZIP">
            <opentelemetry:headers >
                <opentelemetry:header key="testHeader" value="testHeaderValue" />
            </opentelemetry:headers>
            <opentelemetry:config-properties >
                <opentelemetry:config-property key="otel.logs.exporter" value="otlp" />
            </opentelemetry:config-properties>
        </opentelemetry:otlp-exporter>
    </opentelemetry:exporter>
    <opentelemetry:resource-attributes >
        <opentelemetry:attribute key="mule.env" value="Dev" />
    </opentelemetry:resource-attributes>
</opentelemetry:config>
When additional properties from SDK Auto-configuration are needed for exporter, config-properties can be used to add those. Environment and System properties will still override those entries.
Resource Attributes
Common Resource Attributes
Extension uses the OpenTelemetry SDK’s Resource Provider SPI to gather data of common resources such as Host, OS, Processes of the Mule runtime Server and host. SDK supported all common resources providers are configured by this module.
  {
    "host.arch": "x86_64",
    "host.name": "ac0098.local",
    "os.description": "Mac OS X 10.16",
    "os.type": "darwin",
    "process.command_line": "/Applications/AnypointStudio.app/Contents/Eclipse/plugins/org.mule.tooling.jdk.v8.macosx.x86_64_1.1.1/Contents/Home/jre:bin:java -Dmule.home=/Applications/AnypointStudio.app/Contents/....d=1 -Dwrapper.lang.domain=wrapper -Dwrapper.lang.folder=../lang",
    "process.executable.path": "/Applications/AnypointStudio.app/Contents/Eclipse/plugins/org.mule.tooling.jdk.v8.macosx.x86_64_1.1.1/Contents/Home/jre:bin:java",
    "process.pid": "9778",
    "process.runtime.description": "AdoptOpenJDK OpenJDK 64-Bit Server VM 25.282-b08",
    "process.runtime.name": "OpenJDK Runtime Environment",
    "process.runtime.version": "1.8.0_282-b08"
  }
See Disabling Common Resource Providers if any resource provider must be disabled.
Mule Resource Attributes
Extension is aware of CloudHub Reserved Properties and automatically adds some of that data into trace data.
{
    "mule.app.awsRegion": "us-west-2",
    "mule.app.domain": "mule-opentelemetry-app",
    "mule.app.fullDomain": "mule-opentelemetry-app.us-w2.cloudhub.io",
    "mule.csOrganization.id": "f2ea2cb4-c600-gh87-gg78-e952ff5591ee",
    "mule.organization.id": "f2ea2cb4-c600-gh87-gg78-e952ff5591ee",
    "mule.env": "Dev",
    "mule.environment.id": "c06ef9b7-19c0-ss78-kk44-598058b20aad",
    "mule.environment.type": "sandbox",
    "mule.home": "/opt/mule/mule-4.4.0",
    "mule.worker.id": "0"
}
CloudHub does not define any property for organization id. mule.organization.id refers to value of a system property csOrganization.id defined by CloudHub.
|
Exporters
Extension supports following exporter configurations -
-
OTLP Exporter
-
Logging Exporter
-
Generic Exporter
| Configured exporter is used for all supported signals. |
OTLP Exporter
Extension contains all dependencies needed to send supported signals to an OpenTelemetry Collector endpoint.
When configuring the OTLP Exporter with HTTP Protobuf protocol, OpenTelemetry collector endpoint must be set to the base endpoint of OTEL collector. The module will build signal-specific endpoints such as {collectorEndpoint}/traces based on OpenTelemetry specification guidelines.
For example, if opentelemetry collector is listening on localhost:4317, then set collectorEndpoint=http://localhost:4317/v1 and NOT collectorEndpoint=http://localhost:4317/v1/traces.
|
When configuring the OTLP Exporter with GRPC protocol, OpenTelemetry collector endpoint must be set to the base endpoint of OTEL collector. For example, if opentelemetry collector is listening on localhost:4317, then set collectorEndpoint=http://localhost:4317 and NOT collectorEndpoint=http://localhost:4317/v1.
|
Troubleshooting
OTLP Exporter failed to export spans. Server responded with HTTP status code 404.
OTLP Exporter is being used but no traces are seen in APM. The logs show below (or similar) error message -
Failed to export spans. Server responded with HTTP status code 404. Error message: Unable to parse response body, HTTP status message: Not Found
This is most likely caused due to incorrect value set for collectorEndpoint. See OTLP Exporter configuration reference for how to configure collector endpoint correctly.
OTLP Exporter with GRPC Protocol failed to export spans with "OTLP endpoint must not have a path: /v1"
This is most likely caused due to incorrect value set for collectorEndpoint. See OTLP Exporter configuration reference for how to configure GRPC collector endpoint correctly.
APM Collector does not support OTEL standard endpoint format
A few APMs may not have the OTEL standard endpoint format of {collectorEndpoint}/{signal}. In that case, the default config property of collectorEndpoint may not work to auto-build the single endpoints.
In such cases, opentelemetry-config-properties can be used to define trace endpoint with otel.exporter.otlp.{signal}.endpoint property where signal can be traces or metrics.
<opentelemetry:otlp-exporter collectorEndpoint="${otel.collectorEndpoint}">
    <opentelemetry:config-properties >
        <opentelemetry:config-property key="otel.exporter.otlp.traces.endpoint" value="${my-custom-otel-trace-endpoint-url}" />
    </opentelemetry:config-properties>
</opentelemetry:otlp-exporter>
Logging Exporter
When troubleshooting generated signal data, sending it to logs may be useful. Extension supports a simple logging exporter that can send signal data to application’s log file.
<opentelemetry:config name="OpenTelemetry_Logging" doc:name="OpenTelemetry Config" serviceName="app1" >
    <opentelemetry:exporter >
        <opentelemetry:exporter>
            <opentelemetry:logging-exporter />
        </opentelemetry:exporter>
    </opentelemetry:exporter>
</opentelemetry:config>
Example span entry from log file -
[INFO ] [2022-10-13 15:54:37,141] [[MuleRuntime].uber.08: [orders-exp-api].submit-order-flow.CPU_INTENSIVE @1be1852e] [event: dd4e8f20-4b30-11ed-87e6-c889f3a9023b] [io.opentelemetry.exporter.logging.LoggingSpanExporter]: '/api/*' : 0cda0930cbf01126b91402861dbffc74 38d96ac87afdbbe1 SERVER [tracer: mule-opentelemetry-module:1.1.0] AttributesMap{data={http.status_code=201, http.route=/api/*, http.user_agent=PostmanRuntime/7.29.2, mule.app.flow.source.configRef=HTTP_Listener_config, http.scheme=http, http.method=POST, mule.app.flow.name=order-exp-main, http.flavor=1.1, mule.serverId=abcd..orders-exp-api, http.target=/api/orders, mule.correlationId=dd4e8f20-4b30-11ed-87e6-c889f3a9023b, mule.app.flow.source.namespace=http, http.host=localhost:8081, mule.app.flow.source.name=listener}, capacity=128, totalAddedValues=14}Generic Exporter
This generic exporter allows to configure any other signal exporters supported by sdk-extensions/autoconfigure#exporters.
Following example shows possible configuration for sending traces to Zipkin.
| If the generic exporter is used to configure signal specific exporter, then it must be configured appropriately for all supported signals. |
<opentelemetry:config name="OpenTelemetry_Generic" doc:name="OpenTelemetry Config" serviceName="app1" >
    <opentelemetry:exporter >
        <opentelemetry:generic-exporter >
            <opentelemetry:config-properties >
                <opentelemetry:config-property key="otel.traces.exporter" value="zipkin" />
                <opentelemetry:config-property key="otel.exporter.zipkin.endpoint" value="http://localhost:9411/api/v2/spans" />
            </opentelemetry:config-properties>
        </opentelemetry:generic-exporter>
    </opentelemetry:exporter>
</opentelemetry:config>
The required Zipkin exporter dependencies must be configured as an Additional Plugin Dependencies for Mule Maven Plugin.
<plugin>
    <groupId>org.mule.tools.maven</groupId>
    <artifactId>mule-maven-plugin</artifactId>
    <version>${mule.maven.plugin.version}</version>
    <extensions>true</extensions>
    <configuration>
        <additionalPluginDependencies>
            <plugin>
                <groupId>com.avioconsulting.mule</groupId>
                <artifactId>mule-opentelemetry-module</artifactId>
                <additionalDependencies>
                <!--
                    Module uses OpenTelemetry SDK v1.32.0.
                     Any opentelemetry dependencies used here must be at-least v1.32.0
                     or a compatible one.
                -->
                    <dependency>
                        <groupId>io.opentelemetry</groupId>
                        <artifactId>opentelemetry-exporter-zipkin</artifactId>
                        <version>1.32.0</version>
                    </dependency>
                </additionalDependencies>
            </plugin>
        </additionalPluginDependencies>
    </configuration>
</plugin>
Tracing Configuration
Span Processors
For non-logging exporters, Tracing SDK uses Batch Span Processor. Global Configuration allows to customize Batch span processor settings -
<opentelemetry:config name="OpenTelemetry_Config"
    serviceName="otel-comparison-test"
    maxQueueSize="2048"
    maxBatchExportSize="512"
    batchExportDelayInterval="5000"
    exportTimeout="30000">
.... other config ....
</opentelemetry:config>
Span Sampler
By default, every span is recorded. In a high transaction environment, this can become noisy or needing high storage requirements for backend APM. In such cases, it is possible to reduce the span recorded and sent to the APM. This can help reduce the network traffic as well as data sent to the backend. Although, it comes at a cost of not collecting all traces, which maybe acceptable in certain use cases.
The Sampler configures weather spans will be recorded when they are started by the module. Unrecorded spans are skipped from exporting to backend APM.
Module config doesn’t have any elements to set the sampler configuration, but it can be applied using OpenTelemetry’s system properties.
| System property | Environment variable | Description |
|---|---|---|
otel.traces.sampler |
OTEL_TRACES_SAMPLER |
The sampler to use for tracing. Defaults to |
otel.traces.sampler.arg |
OTEL_TRACES_SAMPLER_ARG |
An argument to the configured tracer if supported, for example a ratio. |
See Sampler documentation for more details.
For example, to set the TraceId Ratio based sampler, you can add following two properties -
otel.traces.sampler=parentbased_traceidratio
otel.traces.sampler.arg=0.001 (1)| 1 | Sets the trace id ratio to 1 in 1000. Resulting configuration will record 1 in 1000 traces. |
Trace Spans
By default, this module will create trace spans for following mule components -
-
Flows
-
HTTP Listener and Request
-
Database Connector
-
Anypoint MQ Connector
More verbose span generation can be configured. See setting Trace Levels below.
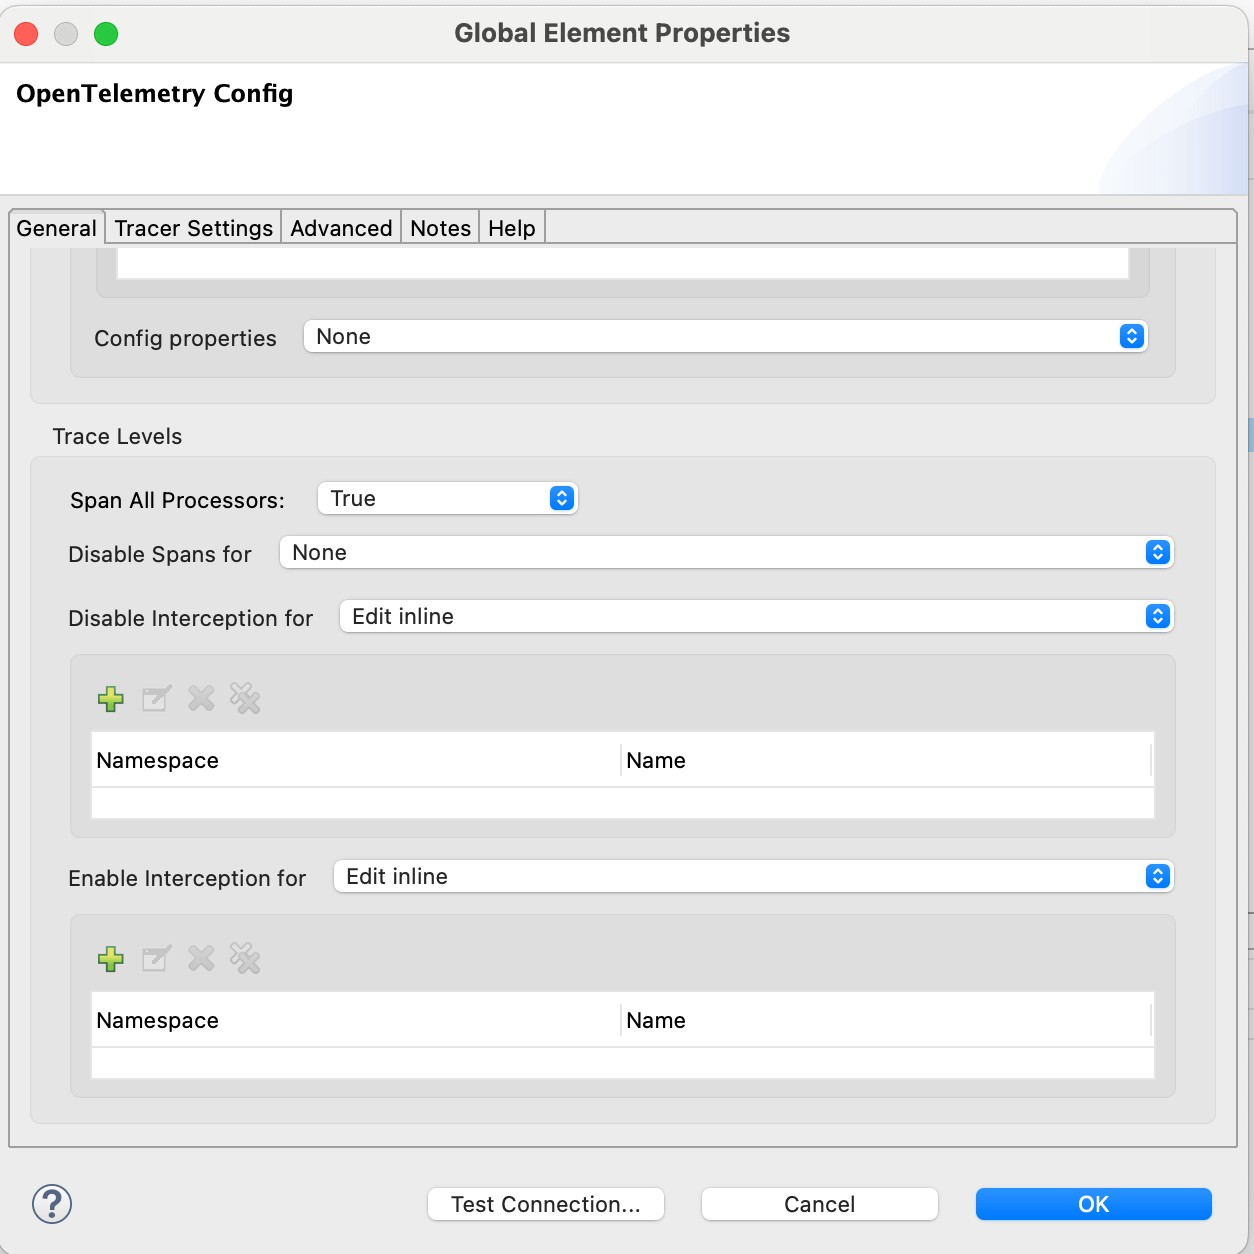
Trace Levels
Module can create spans for every mule processors by setting spanAllProcessors = "true". This can be overridden by setting a system property mule.otel.span.processors.enable to true|false.
When the span generation for all processors is enabled, opentelemetry:ignore-mule-components allows to set a list of processors to exclude from span generation.
<opentelemetry:config name="OpenTelemetry_Generic" doc:name="OpenTelemetry Config" serviceName="app1"  spanAllProcessors="true">
    <opentelemetry:exporter >
        <opentelemetry:generic-exporter >
            <opentelemetry:config-properties >
                <opentelemetry:config-property key="otel.traces.exporter" value="zipkin" />
                <opentelemetry:config-property key="otel.exporter.zipkin.endpoint" value="http://localhost:9411/api/v2/spans" />
            </opentelemetry:config-properties>
        </opentelemetry:generic-exporter>
    </opentelemetry:exporter>
    <opentelemetry:ignore-mule-components >
        <opentelemetry:mule-component namespace="MULE" name="LOGGER" />
        <opentelemetry:mule-component namespace="os" name="*" />
    </opentelemetry:ignore-mule-components>
</opentelemetry:config>
To disable span generation for all processors in a specific namespace, set the name attribute to *
-
<opentelemetry:mule-component namespace="os" name="*" />
Custom Tags
In addition to all the trace attributes captured by the module, it is possible to add custom tags to the current trace using an operation opentelemetry:add-custom-tags.
All custom tag keys are transformed to custom.{keyName}. This also prevents accidentally overriding other standard keys-value pairs in trace tags. Depending on the APM (elastic, etc.) you use, they may be displayed differently. For example, elastic will display them as label.custom_{keyName}.
|
These could be any business data that you may want to capture as a part of your telemetry data. For example, an order number for an order processing transaction.
    <opentelemetry:add-custom-tags doc:name="Add Custom Tags"
                config-ref="OpenTelemetry_Config">
        <opentelemetry:tags >
            <opentelemetry:tag key="orderNumber" value="#[vars.orderNumber]"/>
        </opentelemetry:tags>
    </opentelemetry:add-custom-tags>
You can also use dataweave to set the tags.
    <opentelemetry:add-custom-tags doc:name="Add Custom Tags"
                config-ref="OpenTelemetry_Config"
                tags="#[output java --- {orderNumber: payload.orderNumber}]" />
Global Config Span tags
Some APMs may require additional tags on spans for the correct display of traces. For example, Splunk APM can use peer.service on http request spans when creating inferred services in service maps.
The module may not be capturing those tags out of the box but there is a way to add additional tags to the spans of components that use global configuration elements. Some examples would be http:listener using http:listener-config, db:insert using db:config.
For such cases, the module recognizes system properties defined with property names following the pattern {global_config_element_name}.otel.{tag_name} and adds {tag_name}:{property_value} as tags to spans generated for all components using {global_config_element_name} named global element.
| Any tags set using this system properties, will override module generated value for same tags. |
Few things to consider when using Global Tags:
-
Global Config spans are supported via System Properties. Setting global-property in mule configuration does not go in System Properties and hence won’t work. Check System Properties for On-Prem or Runtime Manager to set attribute values.
-
This feature can ONLY add/modify Span attributes, and not the name, kind or other non-attribute data on the span. Most of the APMs may use Span name in Trace UI, and it is NOT possible to change how this module uses OpenTelemetry guidelines to compute span names.
In case of Splunk, peer.service attribute should have the name of the remote http system being invoked. Consider following mule requester example -
    <!-- Global HTTP Request Configuration element -->
    <http:request-config name="Remote_Request_configuration" doc:name="HTTP Request configuration"> (1)
        <http:request-connection host="${http.host}" port="${http.port}" />
    </http:request-config>

    <!-- Flow including http:request that references above global config -->
    <flow name="mule-opentelemetry-app-requester-remote" >
        <http:listener doc:name="Listener" config-ref="HTTP_Listener_config" path="/test-remote-request"/>
        <http:request method="GET" doc:name="Request" config-ref="Remote_Request_configuration" path="/test/remote/target"/> (2)
        <logger level="INFO" doc:name="Logger"/>
    </flow>
To add a tag peer.service=my_remote_api to http:request 's span, you can set following system property on mule runtime -
Remote_Request_configuration.otel.peer.service=my_remote_apiContext Propagation
This module supports context propagation in W3C Trace Context and W3C Baggage Context formats.
Context Extraction
Extension supports extracting Open Telemetry Trace context extraction for certain source components. For these components if the Context information is received in appropriate place, the module will establish the parent-child relation for the traces.
Source Components supporting context extraction:
-
HTTP Listener: Context information, if exists, is extracted from request headers
-
Anypoint MQ Subscription: Context information, if exists, is extracted from Anypoint MQ Message properties
| OpenTelemetry Trace Context is extracted/injected using configured Propagators. The entries in the context may vary depending on the propagators used and validations it applies. All examples here are with W3C Trace Context. |
Context Injection
To help with the context propagation, module allows to inject context into flow variables. This context includes following trace attributes -
-
TRACE_TRANSACTION_ID - An internal transaction id within Mule Context
-
traceId - Trace id of the current request
-
traceIdLongLowPart - Long value of the Trace Id Low part
-
spanId - Span Id for the component used for creating context
-
OpenTelemetry Trace attributes such as traceparent, tracestate
Context can be injected in two ways, as described below.
Auto Injection to Flow Variables
Extension uses a processor interceptor. OpenTelemetry’s tracing context will be automatically added to a flow variable before the first processor is invoked. It is always injected under a key OTEL_TRACE_CONTEXT.
-
Before the first processor is invoked - this context relates to the flow span instead of any specific processor
-
Before certain outbound specific processors are invoked - this context is specific to the span of the processor being intercepted
| In case interception needs to be disabled, set the system property "mule.otel.interceptor.processor.enable" to "false". Disabling the interceptor processing can result in incorrect context propagation. |
First Processor Interceptor
When the flow execution starts, OpenTelemetry context is injected into flow variables before the first processor of the flow is invoked.
| This context relates to the main flow span and if used for propagation to external services then span rendering may not look accurate.See processor interceptor below. |
| OTEL_TRACE_CONTEXT.spanId will be of the flow container span. |
Following examples show a W3C Trace Context extracted from incoming http request and injected into flow variables:
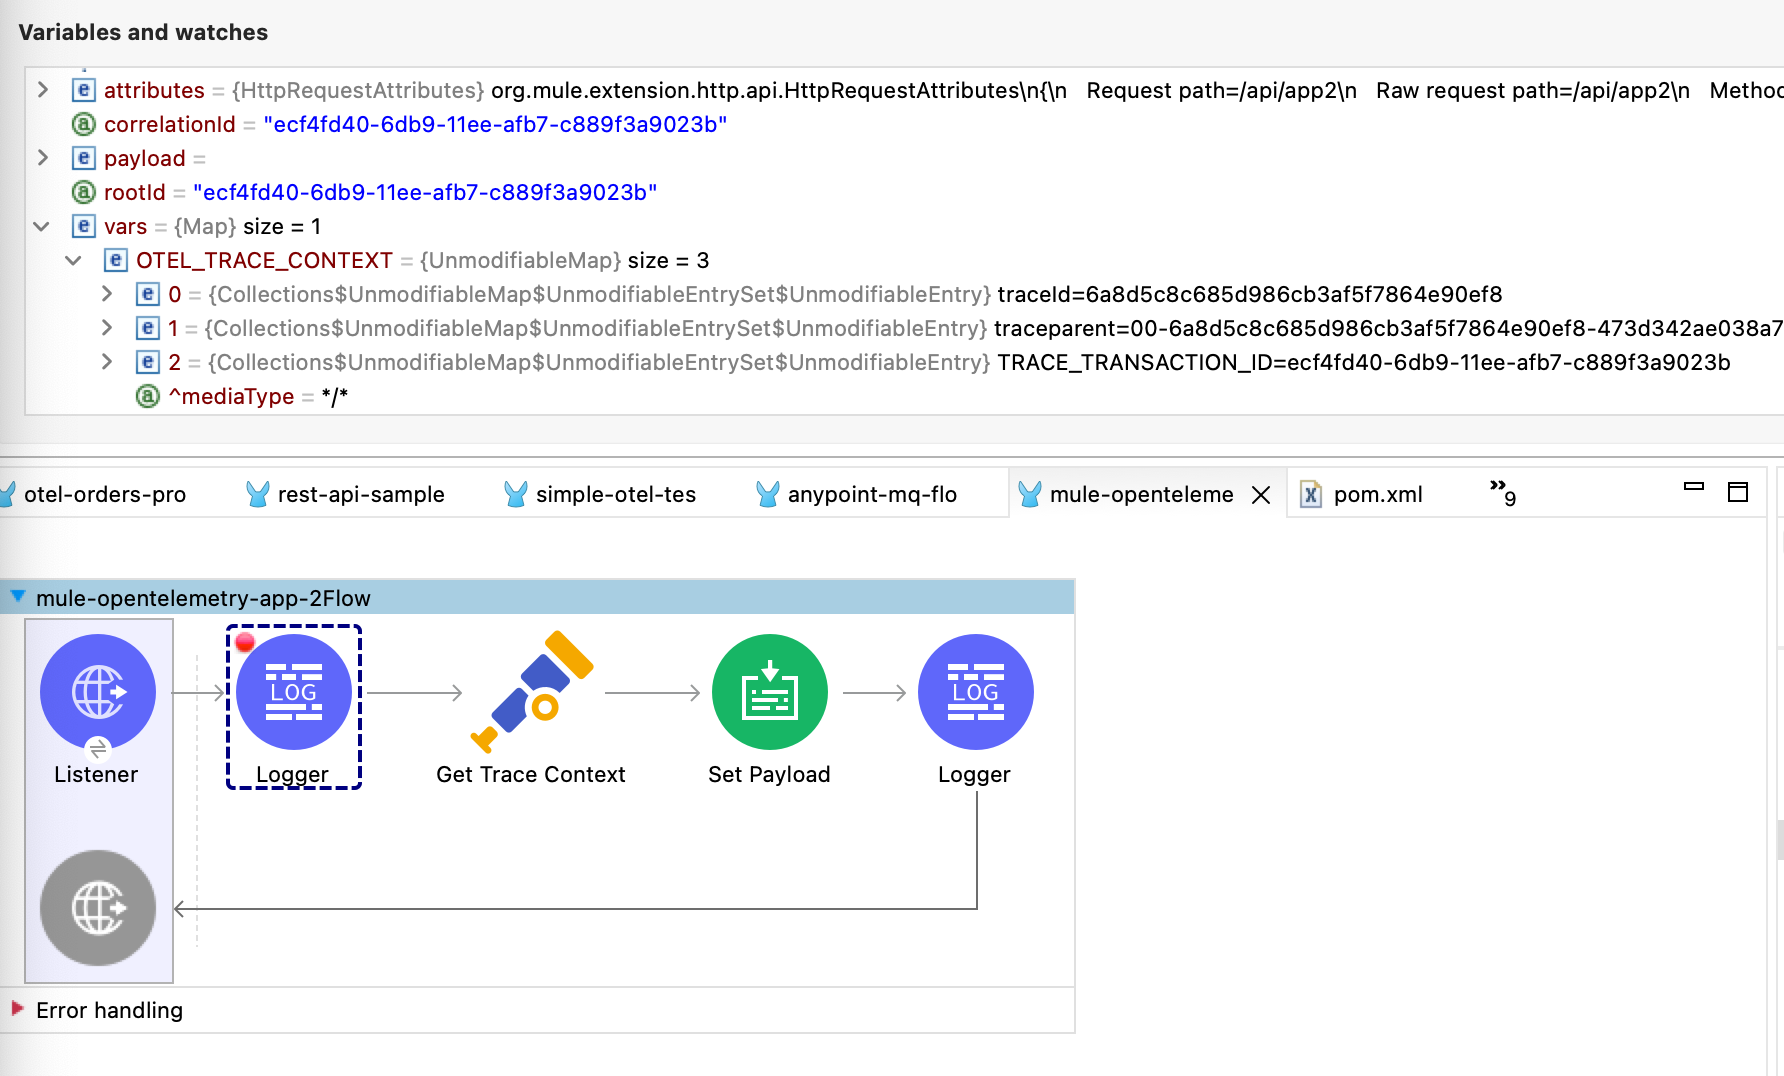
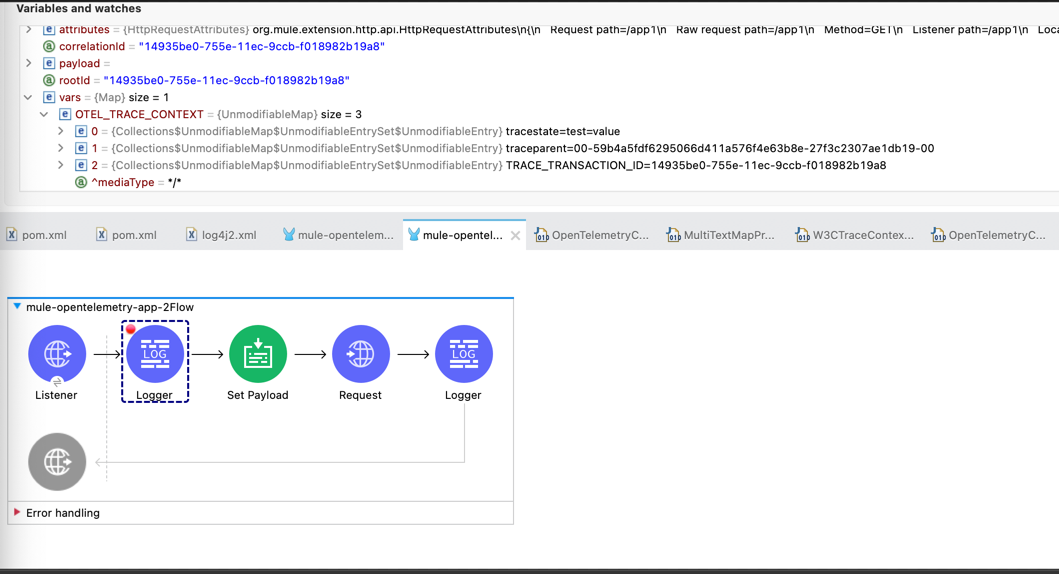
Another variation when tracestate is received with traceparent
Processor Interceptor
For the context propagation accuracy, certain processors are intercepted to inject current span’s context into the flow variable.
| OTEL_TRACE_CONTEXT.spanId will be of the span of the intercepted component. |
By default, any processors in the ee,mule,validations,aggregators,json,oauth,scripting,tracing,oauth2-provider,xml,wss,spring,java,avio-logger namespaces are excluded from this context injection, with one exception.
There is one exception in mule namespace - flow-ref. All flow-ref 's are intercepted for context injection. Module’s flow processing is capable of extracting this flow-ref context to create accurate parent-child span relationship between calling and referenced flows.
All other processors such as http:request, anypoint-mq:publish etc. are intercepted and context is injected.
As a result of this, for example, when http:request makes an outbound request and context is injected, http:request processor’s span is propagated as a prent span.
If the intercepted processors needs fine-tuning such as including or excluding certain processors then it can be done in the Trace Level global configuration.
Manual Injection
If needed, <opentelemetry:get-trace-context /> operation can be used to manually inject trace context into flow.
target must be used to set operation output to a flow variable.
|
| OTEL_TRACE_CONTEXT.spanId will be of the flow container span. |
| Similar to First Processor Interceptor, tis context relates to the main flow span and if used for propagation to external services then span rendering may not look accurate. |
<opentelemetry:get-trace-context doc:name="Get Trace Context" config-ref="OpenTelemetry_Config" target="traceContext"/>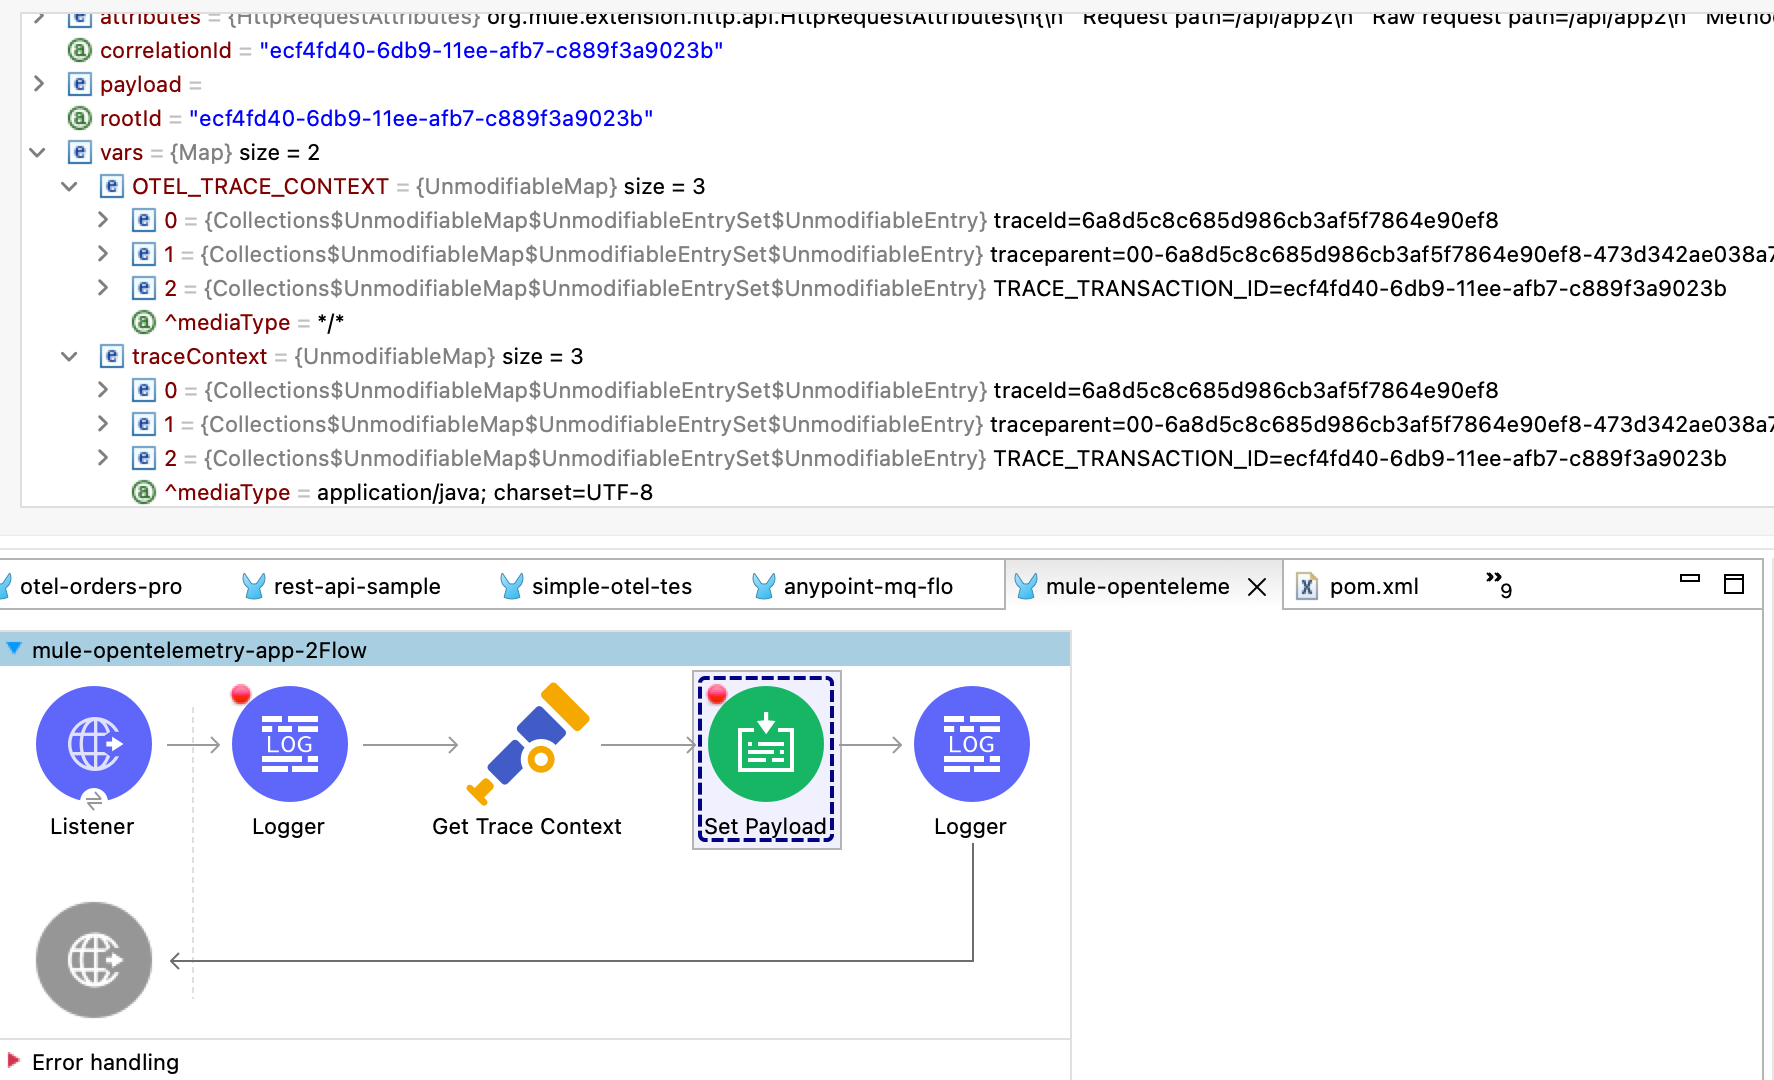
HTTP Request Context Injection
The Module does NOT support automatic context propagation. In order to propagate the trace header information to other web applications, the Mule HTTP Requester Operation OR Configuration must be configured to propagate following http headers -
Key |
Value |
|
|
|
|
Using Operation vs. Global Configuration:
HTTP Outbound headers can be added at HTTP Request Operation level OR as a default headers in HTTP Request Global Configuration.
HTTP Global configuration may be easier from code modifications perspective i.e. just at one global level. That comes at the cost of performance because using expressions in configurations makes it a dynamic configuration.
On the other hand, using headers section in HTTP Request operation may need modification of every http:request operation, but then it keeps the global configuration as a static configuration for runtime to reuse the same instance.
| Using Static configurations is a preferred approach from performance perspective. Dynamic is only recommended for lower request volume uses cases. For more information on performance impact, see performance report section. |
Propagation with Request Operation:
To propagate context using request operation, add/append request headers section of every http:request operation to include following entries -
<http:request method="GET" doc:name="Request" doc:id="f187cd33-70ce-4e09-96e0-70115c3ac727" config-ref="HTTP_Request_configuration" path="/api/path">
    <http:headers ><![CDATA[#[output application/java
---
{
"traceparent": vars.OTEL_TRACE_CONTEXT.traceparent as String,
"tracestate": vars.OTEL_TRACE_CONTEXT.tracestate default '' as String
}]]]>
    </http:headers>
</http:request>
Propagation with Requester Global Configuration:
In order to propagate the trace header information to other web applications, the Mule HTTP Requester Configuration must have default headers configured in the following way:
  1
2
3
4
5
6
7
8

  <http:request-config name="HTTP_Request_configuration"
    doc:name="HTTP Request configuration">
    <http:request-connection host="some-api.us-e1.cloudhub.io" />
    <http:default-headers >
        <http:default-header key='traceparent' value="#[vars.OTEL_TRACE_CONTEXT.traceparent default '' as String]" />
        <http:default-header key='tracestate' value="#[vars.OTEL_TRACE_CONTEXT.tracestate default '' as String]" />
    </http:default-headers>
</http:request-config>
Anypoint MQ Context Injection
When using Anypoint MQ, the publish operation can add vars.OTEL_TRACE_CONTEXT to user properties. If this module is being used by the Anypoint MQ Subscription application, the Context will be extracted from the user properties and linked to the parent incoming trace.
    <anypoint-mq:publish doc:name="Publish" doc:id="8e707130-9ead-4dac-a31e-f7bcb5ce7740" config-ref="Anypoint_MQ_Config" destination="otel-test-queue-1">
        <anypoint-mq:properties ><![CDATA[#[vars.OTEL_TRACE_CONTEXT]]]></anypoint-mq:properties>
    </anypoint-mq:publish>
Turn Off Tracing
Once you have configured the module in your application, there may be a need to remove or temporarily turn it off.
To permanently remove the tracing -
-
Remove the module dependency from pom.xml
-
Remove the global configuration element and xml declaration references
-
Remove any changes made to other Connector configurations for context propagation.
To temporarily disable the tracing without any code changes -
-
Set
turnOffTracing="true"on global config. You may use a property placeholder for the value. -
Alternately, you can set the
mule.otel.tracing.disabledsystem property totrue. -
To re-enable the tracing, just reset the property to
false(default value).
Logs Correlation
When APM backends are used to capture Logs as well as Traces, they might support log and trace correlation. Depending on the APM, some specific attributes maybe needed in the log records to correlate them to the corresponding traces.
Most commonly used attributes include -
-
Trace Id
-
Loggers can access the current trace id with
vars.OTEL_TRACE_CONTEXT.traceId -
Some APM backends (eg. DataDog) may require the Long trace Id instead of the 32-hex-character trace Id value. In that case,
vars.OTEL_TRACE_CONTEXT.traceIdLongLowPart(since v1.6.0) can be used.
-
-
Span Id
-
Introduced with v1.5.0, Loggers can access the flow container span id with
vars.OTEL_TRACE_CONTEXT.spanId -
Some APM backends (eg. DataDog) may require the Long span Id instead of the 16-hex-character span Id value. In that case,
vars.OTEL_TRACE_CONTEXT.spanIdLong(since v1.6.0) can be used.
-
-
Service name
-
Usually a static value, name of the application which can be injected through application properties such as
${domain}
-
-
Deployment Environment
-
Usually a static value, name of the environment which can be injected through application properties such as
${mule.env}
-
Using Mule Tracing Module
To add trace ID and span ID, you may add a mule tracing module to target the Mule application.
    <dependency>
        <groupId>org.mule.modules</groupId>
        <artifactId>mule-tracing-module</artifactId>
        <version>1.0.0</version>
        <classifier>mule-plugin</classifier>
    </dependency>
In the first APIKit flow, add tracing module operations -
    <tracing:set-logging-variable doc:name="Set Trace Id"
        variableName="#['trace_id']"
        value="#[vars.OTEL_TRACE_CONTEXT.traceId]"/>
    <tracing:set-logging-variable doc:name="Set Span Id"
        variableName="#['span_id']"
        value="#[vars.OTEL_TRACE_CONTEXT.spanId default '']" />
Use Log4J JSON Layout
When logging with Log4J, JSONLayout can be used to structure the log records with additional attributes.
    <!-- Console JSON layout that can be used to see full JSON format that will be sent for log aggregation in a real environment -->
    <console name = "CONSOLE_JSON" target = "SYSTEM_OUT">
        <JSONLayout includeTimeMillis="true" compact="false" eventEol="true" objectMessageAsJsonObject="true" properties="true" stacktraceAsString="true">
            <KeyValuePair key="trace_id" value="${ctx:trace_id}"/>
            <KeyValuePair key="span_id" value="${ctx:span_id}"/>
            <KeyValuePair key="service.name" value="$${sys:domain}"/>
            <KeyValuePair key="deployment.environment" value="$${env:mule.env}"/>
            <KeyValuePair key="timestamp" value="$${date:yyyy-MM-dd'T'HH:mm:ss.SSSZZZZ}" />
        </JSONLayout>
    </console>
Generated Documentation
Limitations
-
Automatic header/attribute injections for outbound requests is not supported
-
When using in on-premise mode, all applications deployed to the same runtime will share the same instance of OpenTelemetry configuration. It is unpredictable that which application’s configuration wins. Ideally, the configuration should be same across the applications.
-
When using mule domain projects for global configurations, the generated spans do not include any global configuration or connection tags.
Backends Tested Against
APM Support Testing
OpenTelemetry provides a vendor-agnostic implementation that can be configured to send telemetry data to the backend(s) a.k.a APM(s) of your choice.
As shown in the graphic below, a 2021 GigaOm study concluded that top tier cloud providers are moving to embrace OpenTelemetry quickly and observability vendors are likewise offering integration with OpenTelemetry tools, albeit, at various levels.
The mule-opentelemetry-module can thus export traces to any APM that is OpenTelemetry compatible or has a collector to facilitate opentelemetry formatted data collection.
Following sections will explore the configurations, support and usage of this module for various APMs.
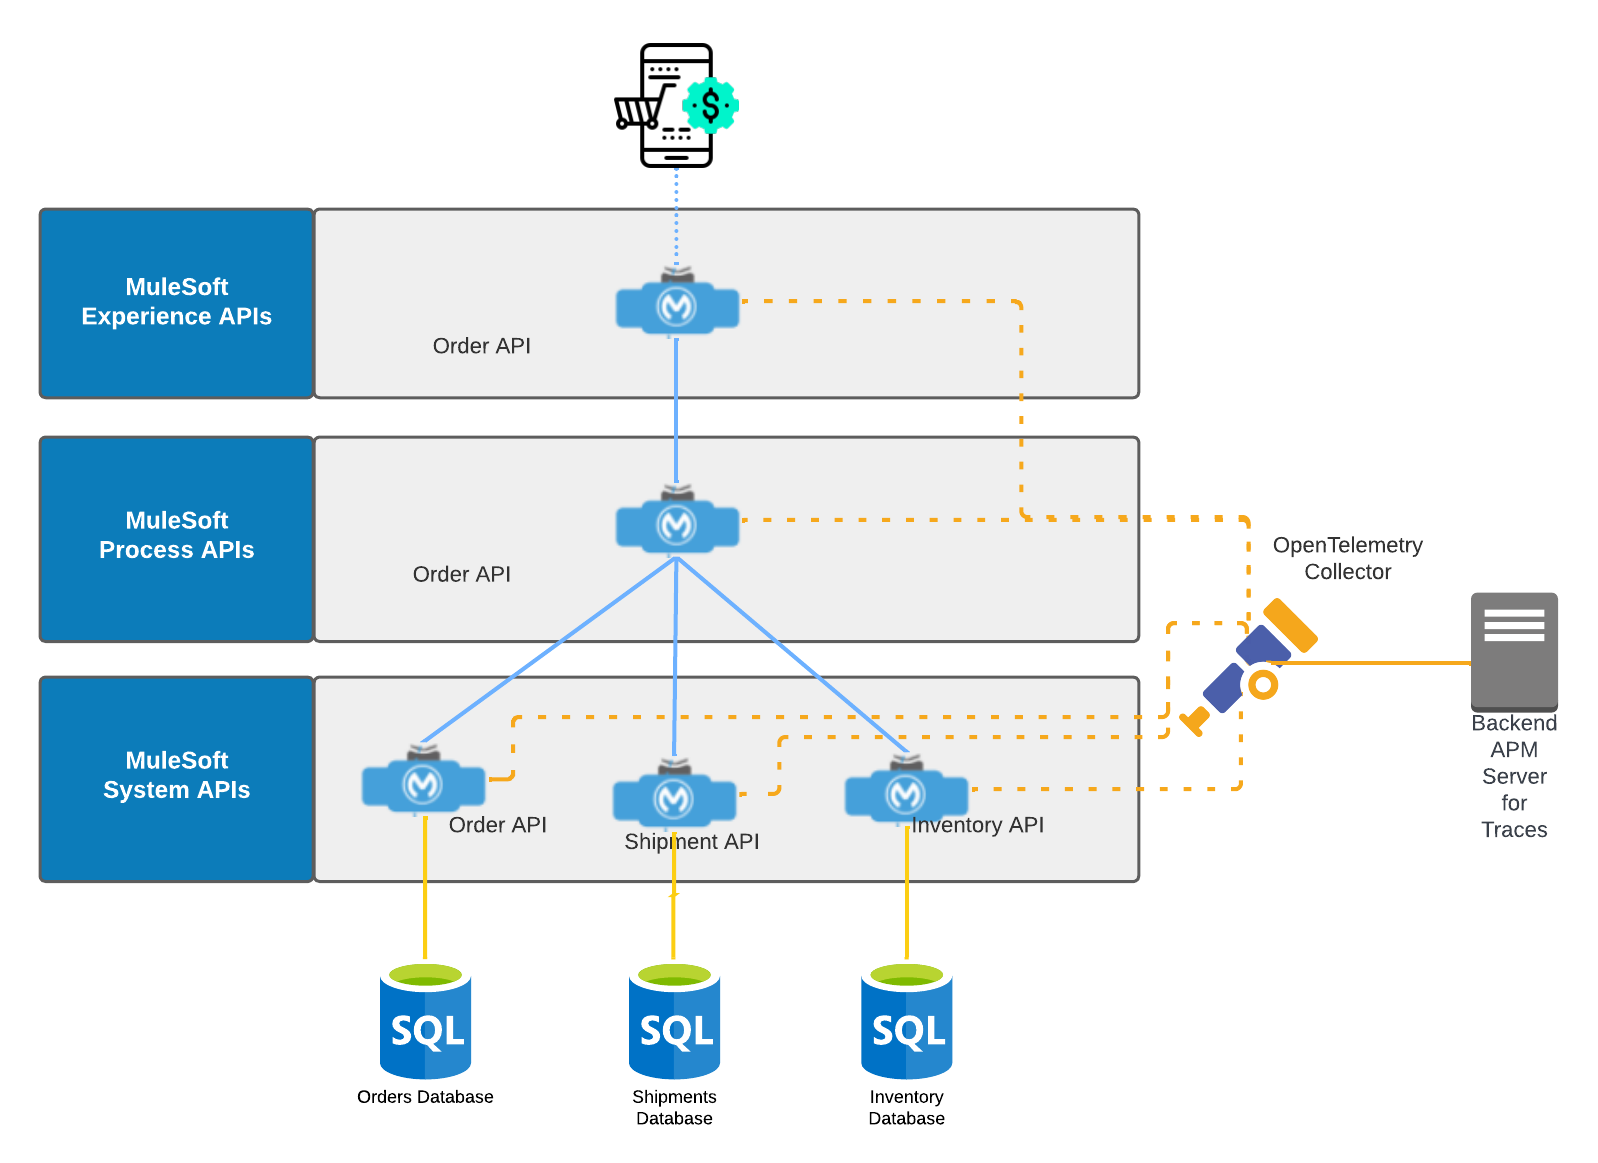
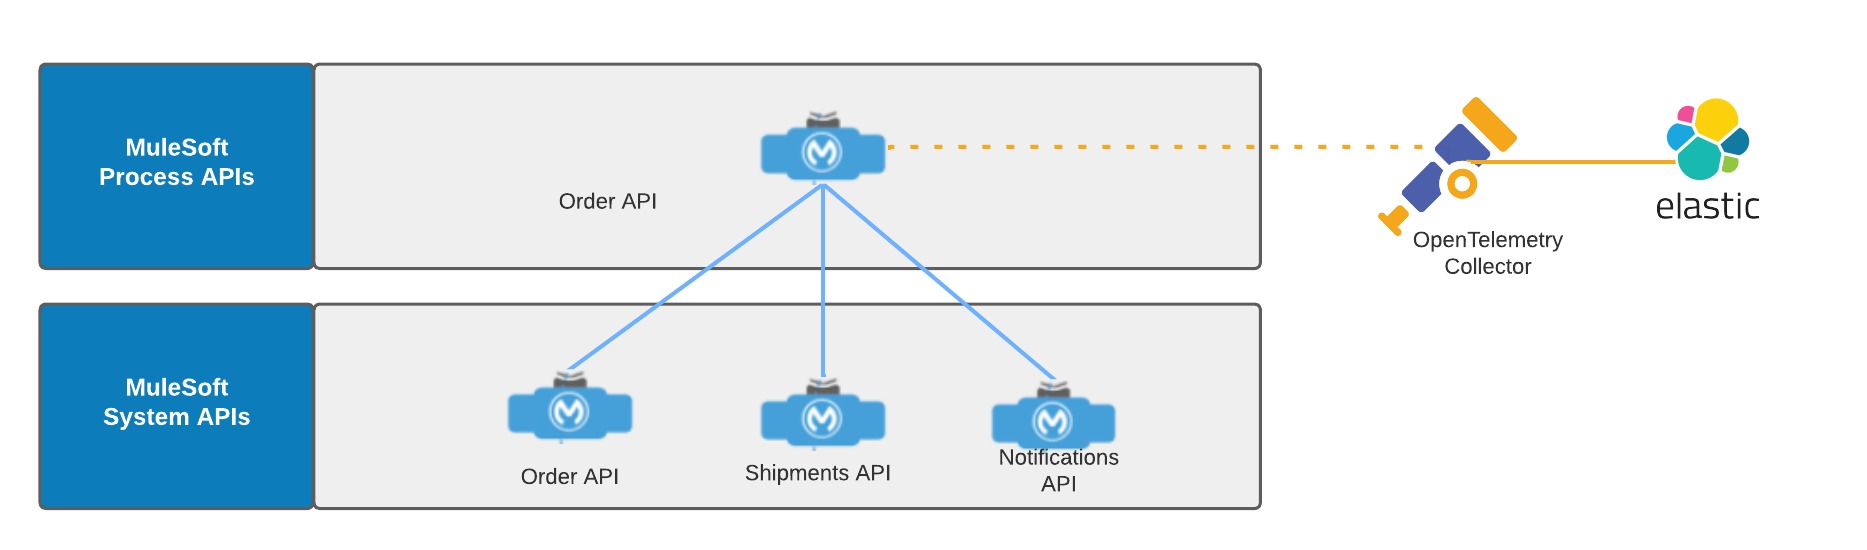
Demo Scenario
For verifying the support of APMs, we will use an Online Order use case. Following API-led diagram shows the different APIs involved in our demo.
APM - Elastic Observability
Elastic Observability is an observability solution built on ELK Stack to converge metrics, logs and traces.
Elastic APM Server natively supports the OpenTelemetry protocol. This means the trace data can be sent directly to Elastic APM Server using the OpenTelemetry protocol.
Configuration
To send traces to Elastic, at the minimum you need following information -
-
OTLP Endpoint URL: APM Server URL. The host and port that APM Server listens for events on.
-
Authorization Token: Either a bearer token OR an API Key to access APM Server URL.
The below is an example of a working module configuration for Elastic Observability. We will look at some elastic specific configuration values.
    <opentelemetry:config name="OpenTelemetry_Config"
        serviceName="${domain}"
        spanAllProcessors="true">
        <opentelemetry:resource-attributes>
            <opentelemetry:attribute key="mule.env"
                value="${mule.env}" />
            <opentelemetry:attribute
                key="deployment.environment" value="${mule.env}" />     (1)
        </opentelemetry:resource-attributes>
        <opentelemetry:exporter>  (2)
            <opentelemetry:otlp-exporter
                collectorEndpoint="${otel.collector.endpoint}">     (3)
                <opentelemetry:headers>
                    <opentelemetry:header key="Authorization" value="${otel.collector.authToken}" /> (4)
                </opentelemetry:headers>
            </opentelemetry:otlp-exporter>
        </opentelemetry:exporter>
</opentelemetry:config>| 1 | Elastic requires deployment.environment resource attribute to enable Service Dependency Maps. |
| 2 | We will use OTLP Exporter configuration to export traces to Elastic |
| 3 | Configure OTLP Endpoint URL to receive traces |
| 4 | Set the Authorization header for APM server. Value should be "Bearer an_apm_secret_token" or "ApiKey an_api_key" depending on authentication token type. |
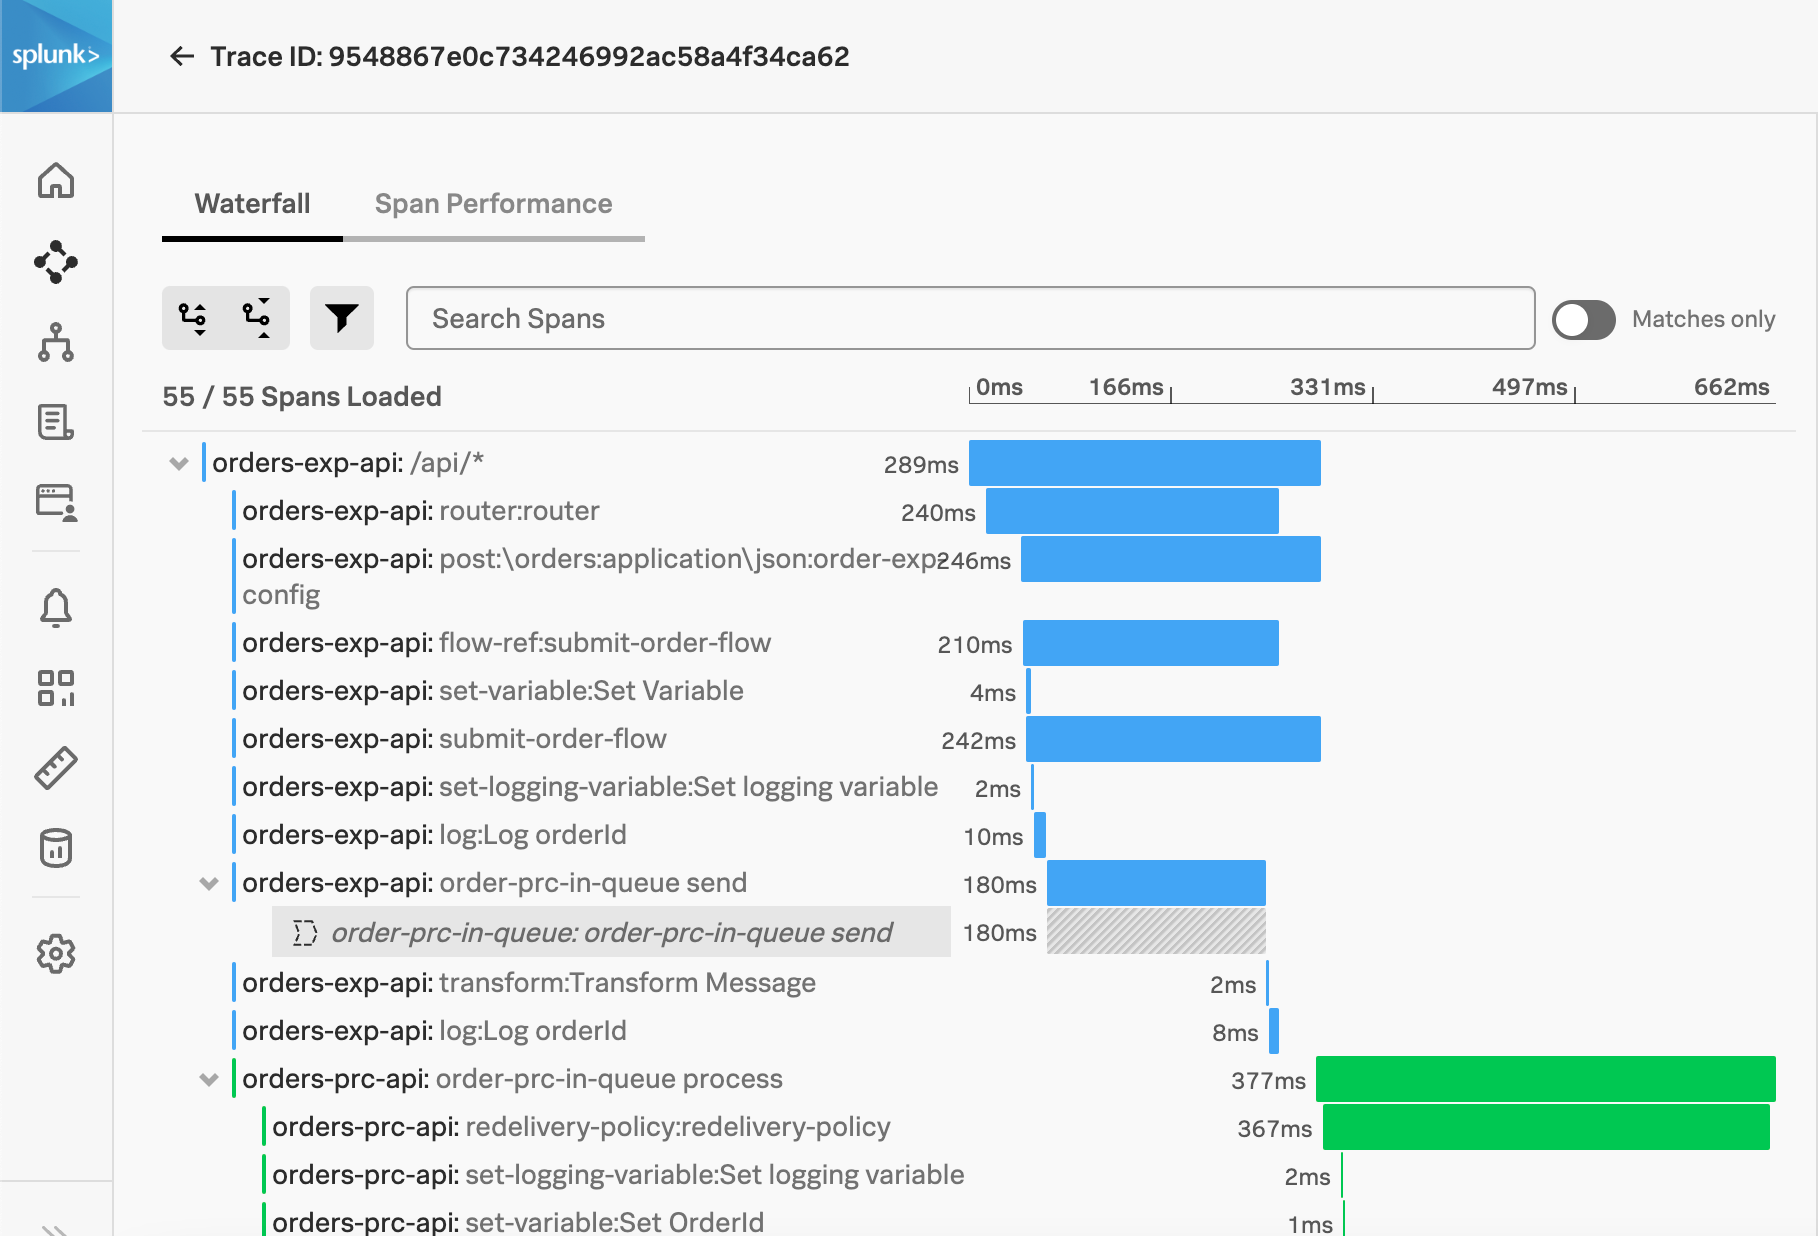
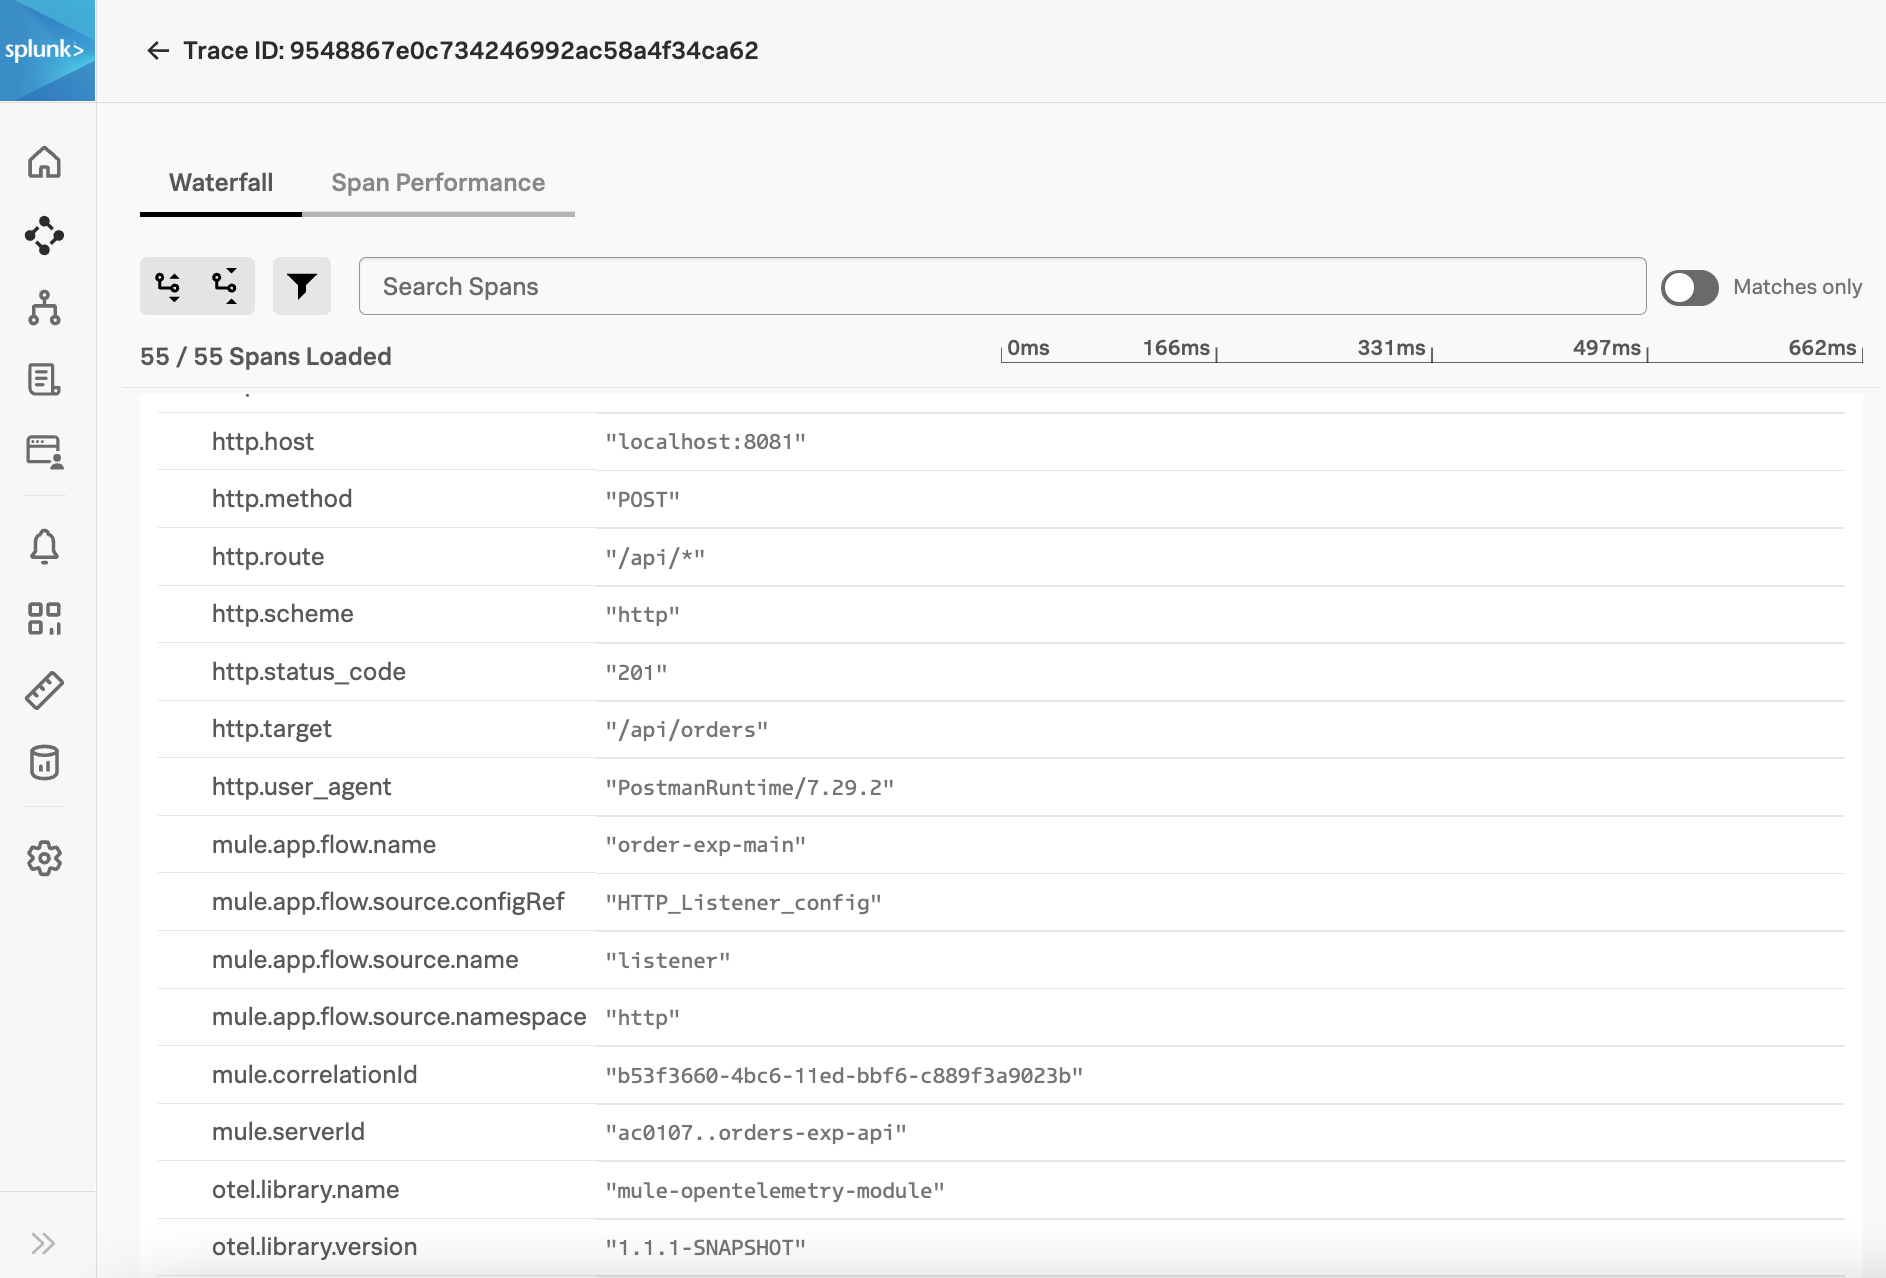
Trace Examples
Here is how a generated trace would look like in Elastic -
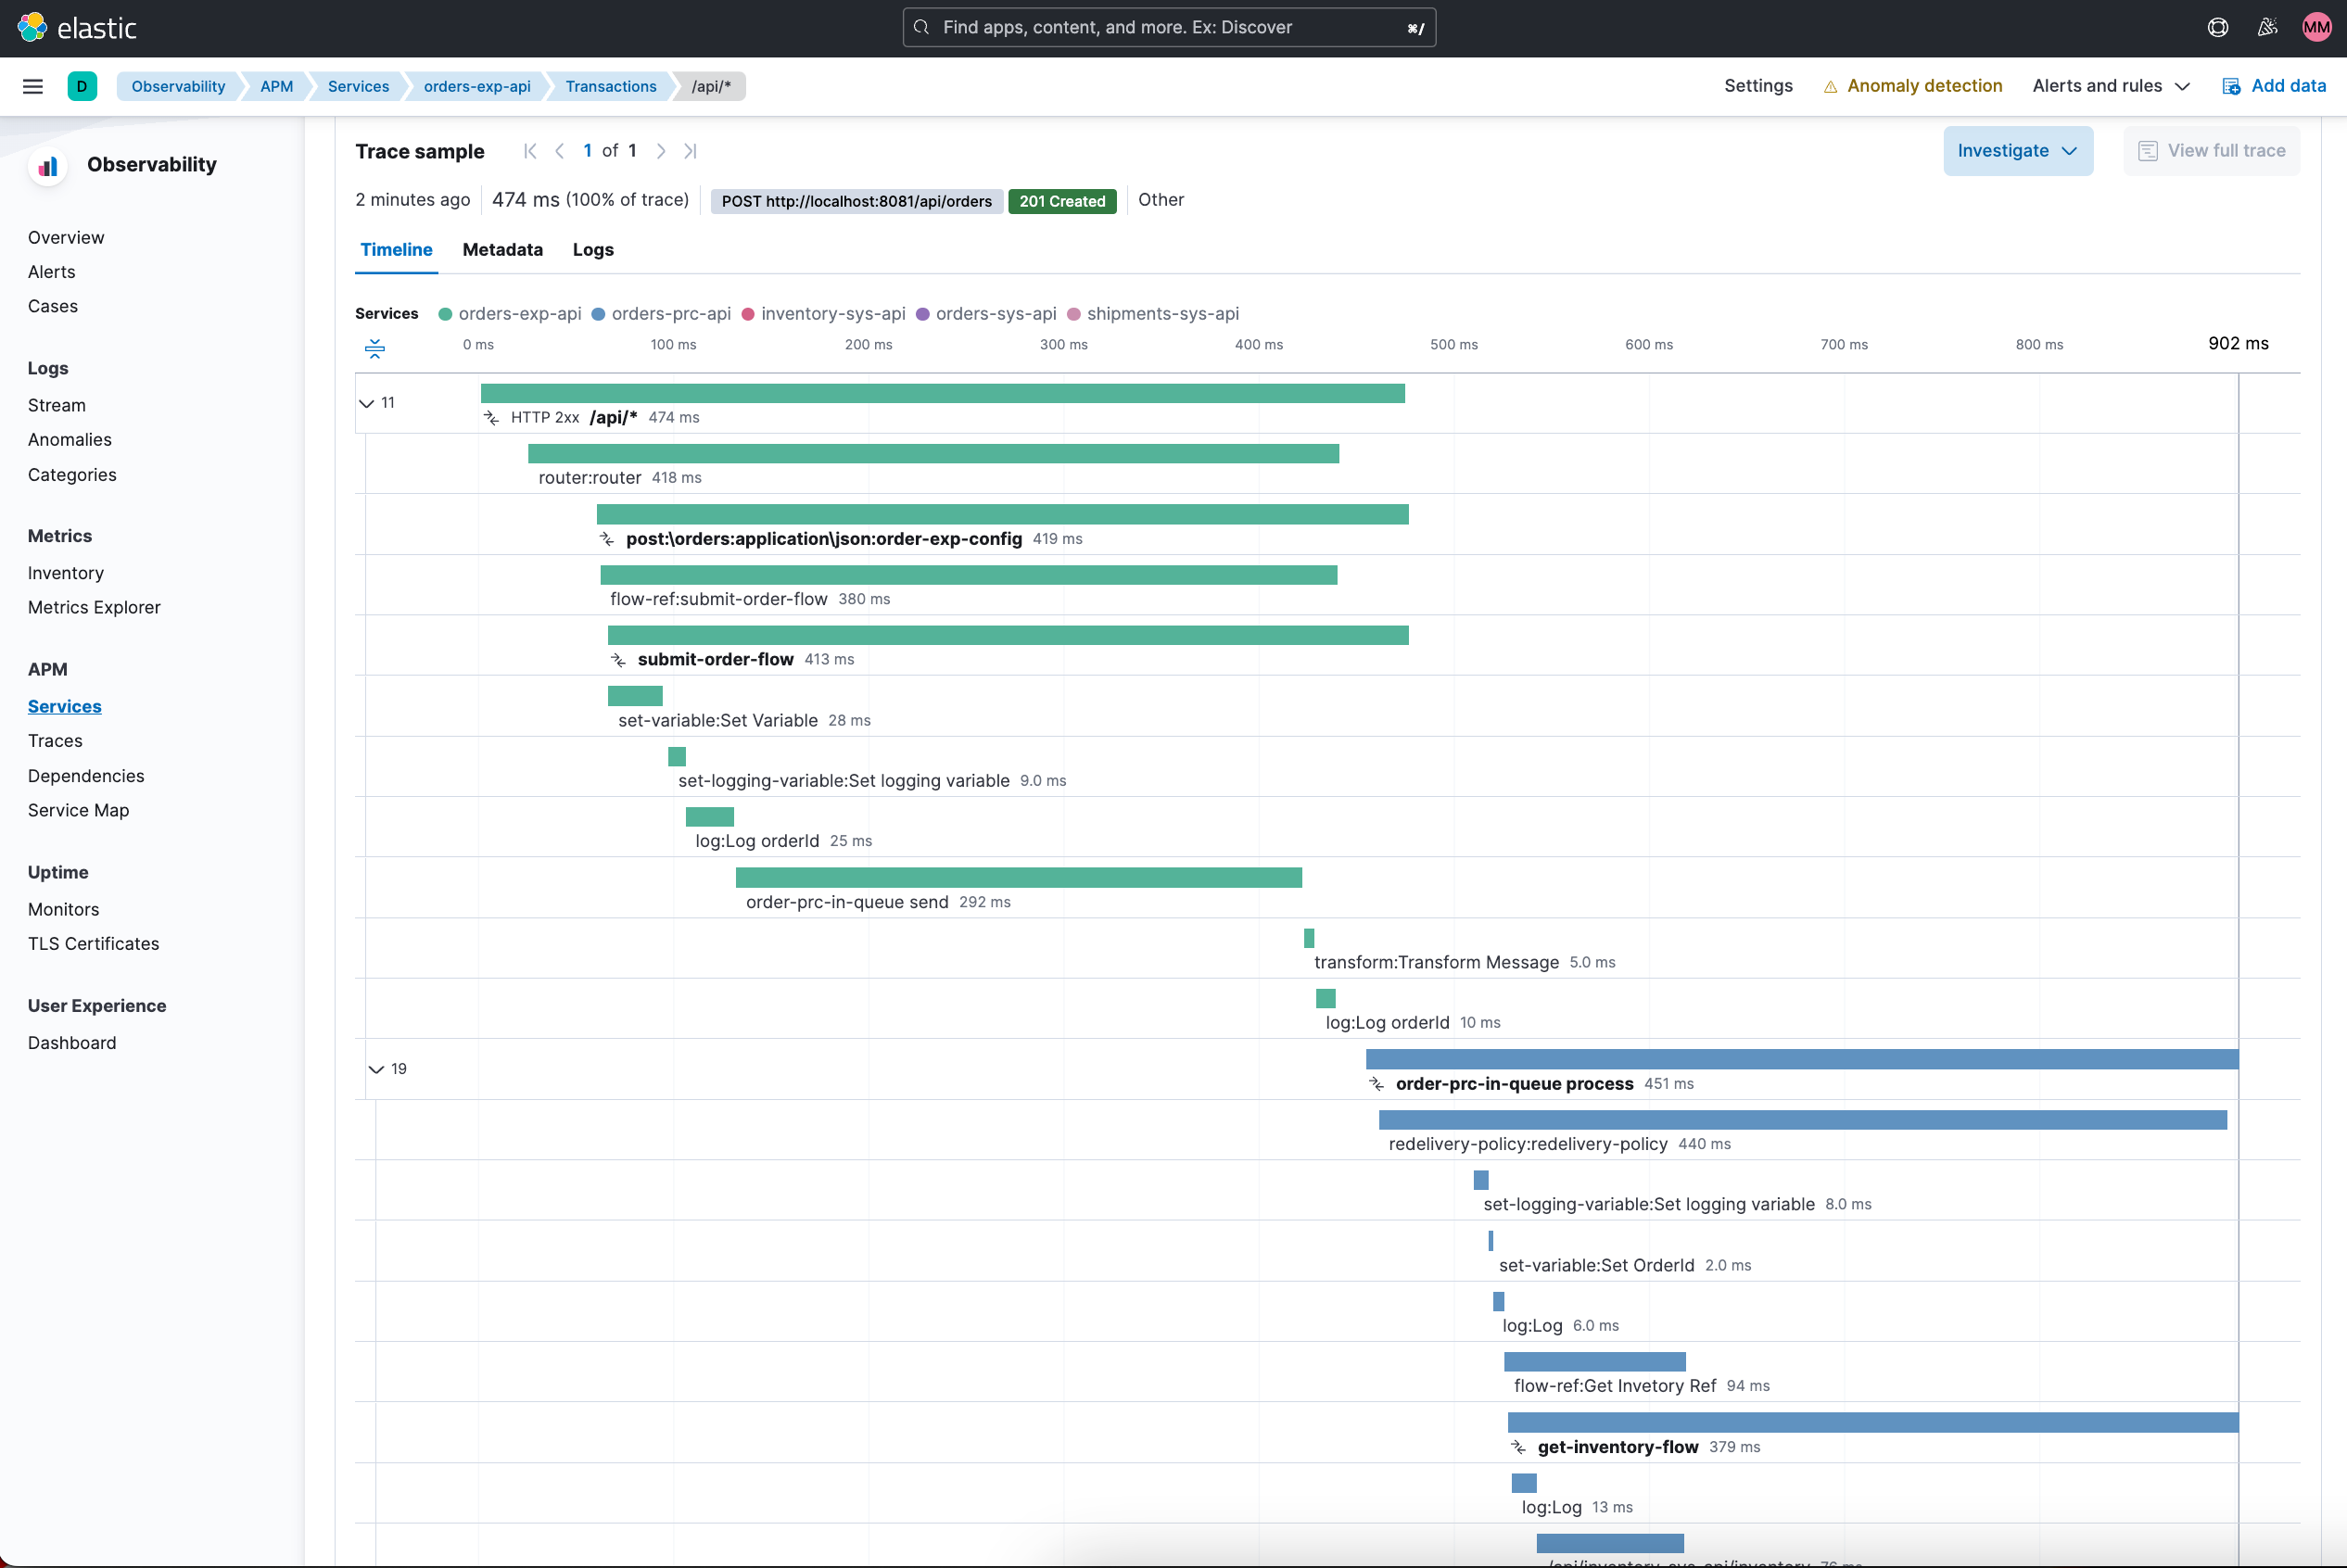
Trace attributes are available under Metadata tab for each trace transaction.
References
APM - Dynatrace
Demo Architecture using Dynatrace Backend
Below is a description of the demo scenario used to generate distributed trace information from 2 Mule applications and have it render in a Dynatrace backend.
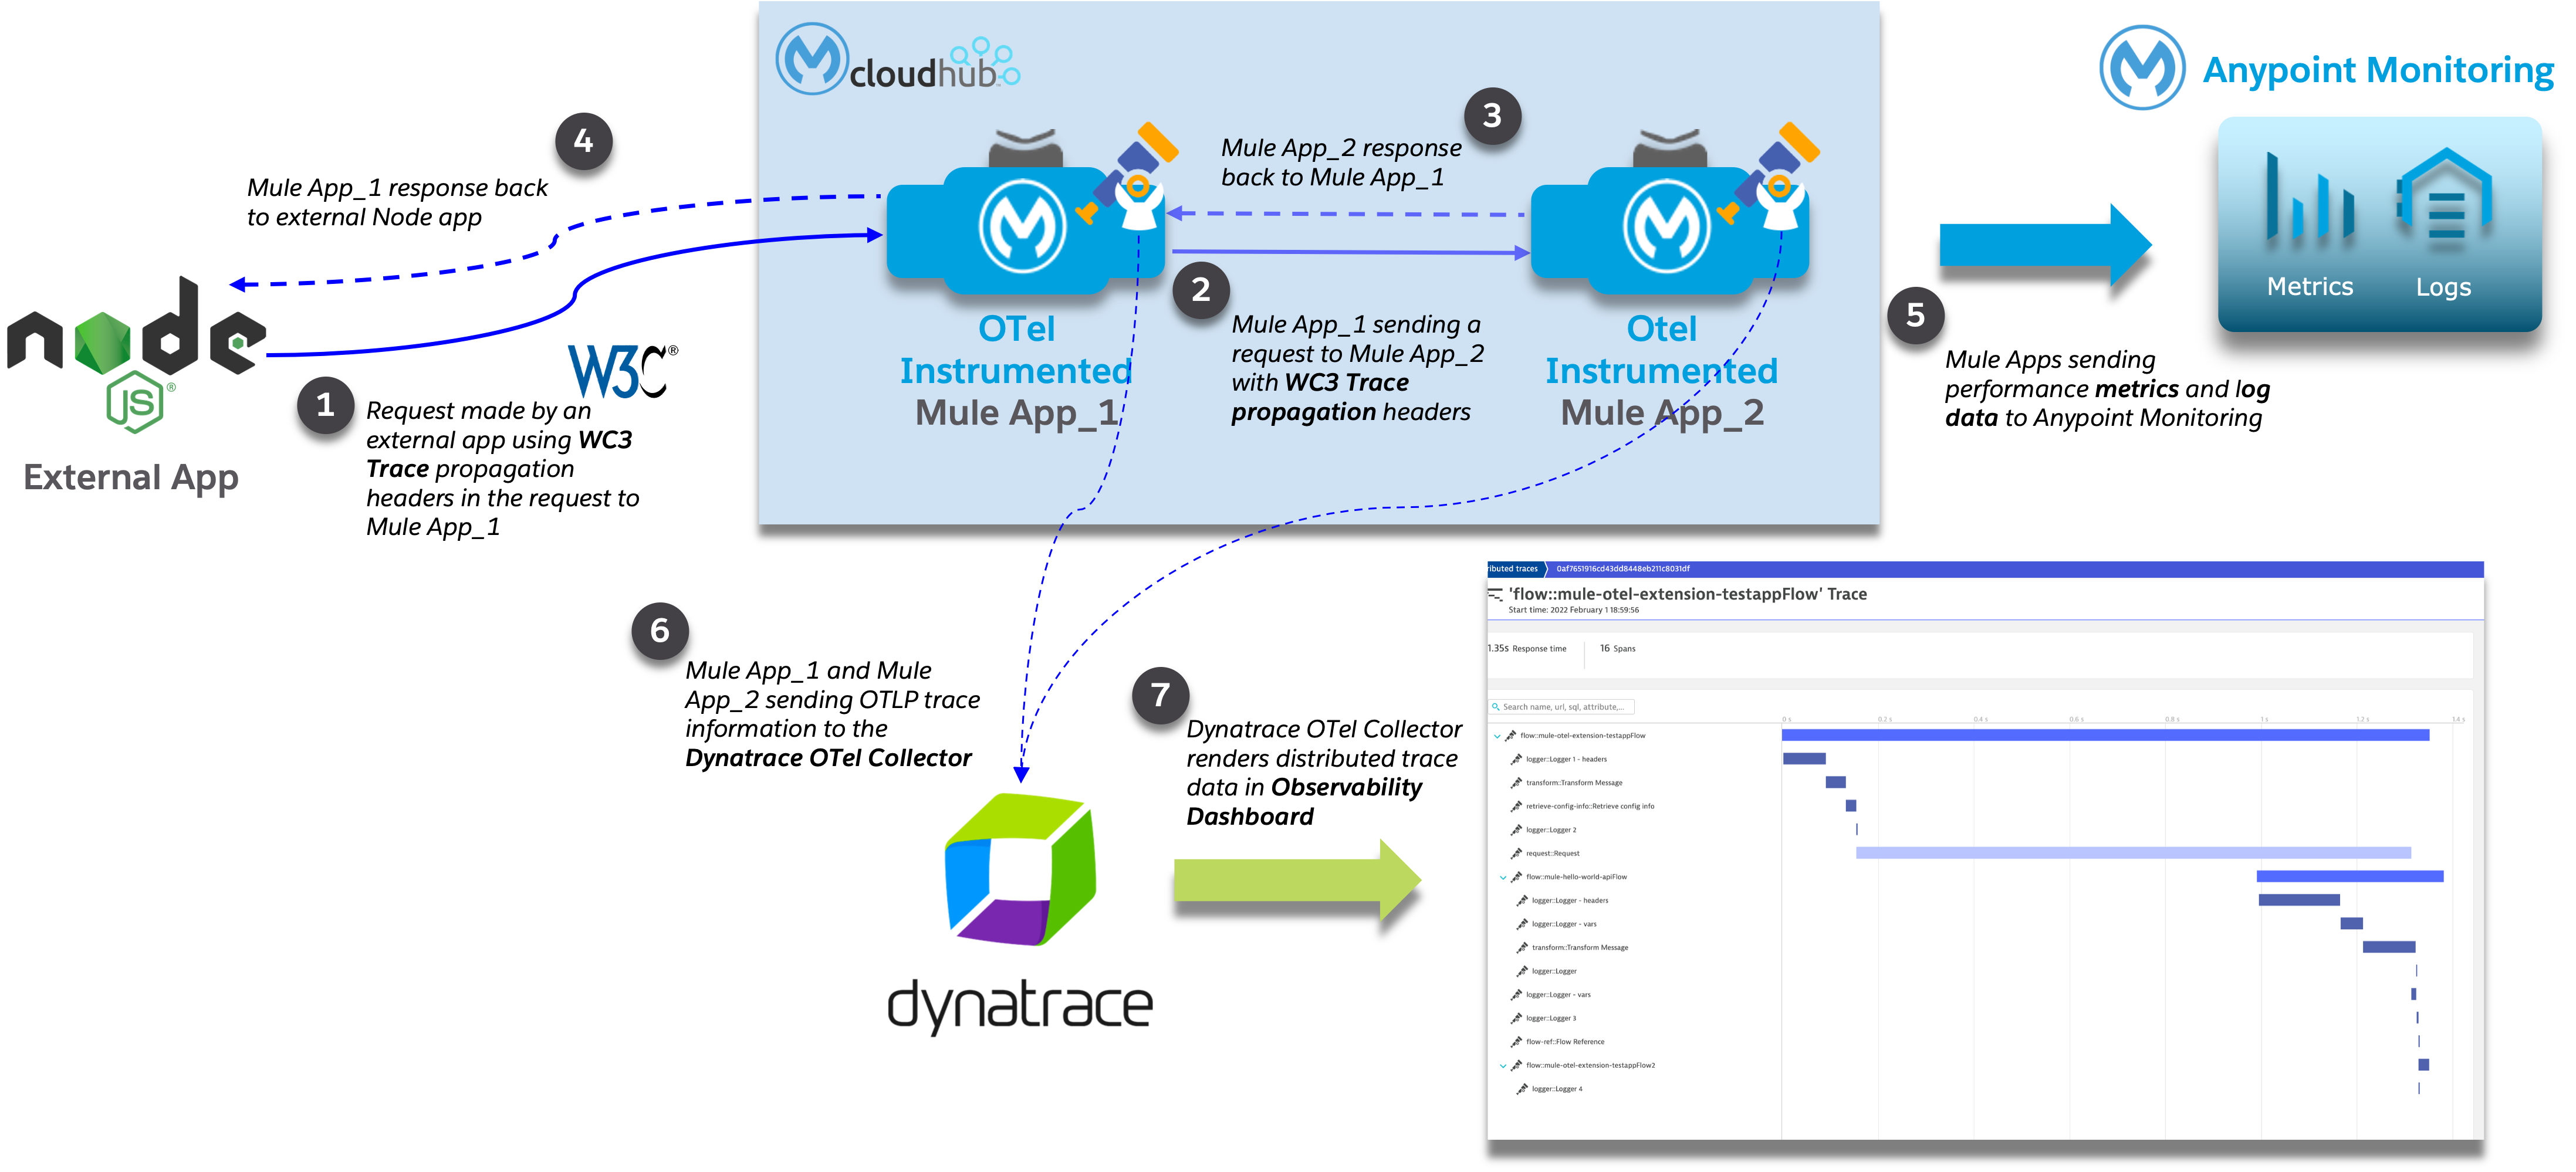
| 1 | External application sending a request to Mule Application 1 with WC3 Trace Context Headers |
| 2 | Mule App 1 sending a request to Mule App 2 and propagating the trace context via WC3 Trace Context Headers |
| 3 | Responses coming back to calling application |
| 4 | Responses coming back to calling application |
| 5 | Both Mule applications sending log and metrics data to Anypoint Monitoring |
| 6 | Mule 4 OpenTelemetry Module sending trace information to Dynatrace OTel Collector |
| 7 | Dynatrace Collector forwarding the data to Dynatrace dashboard for rendering |
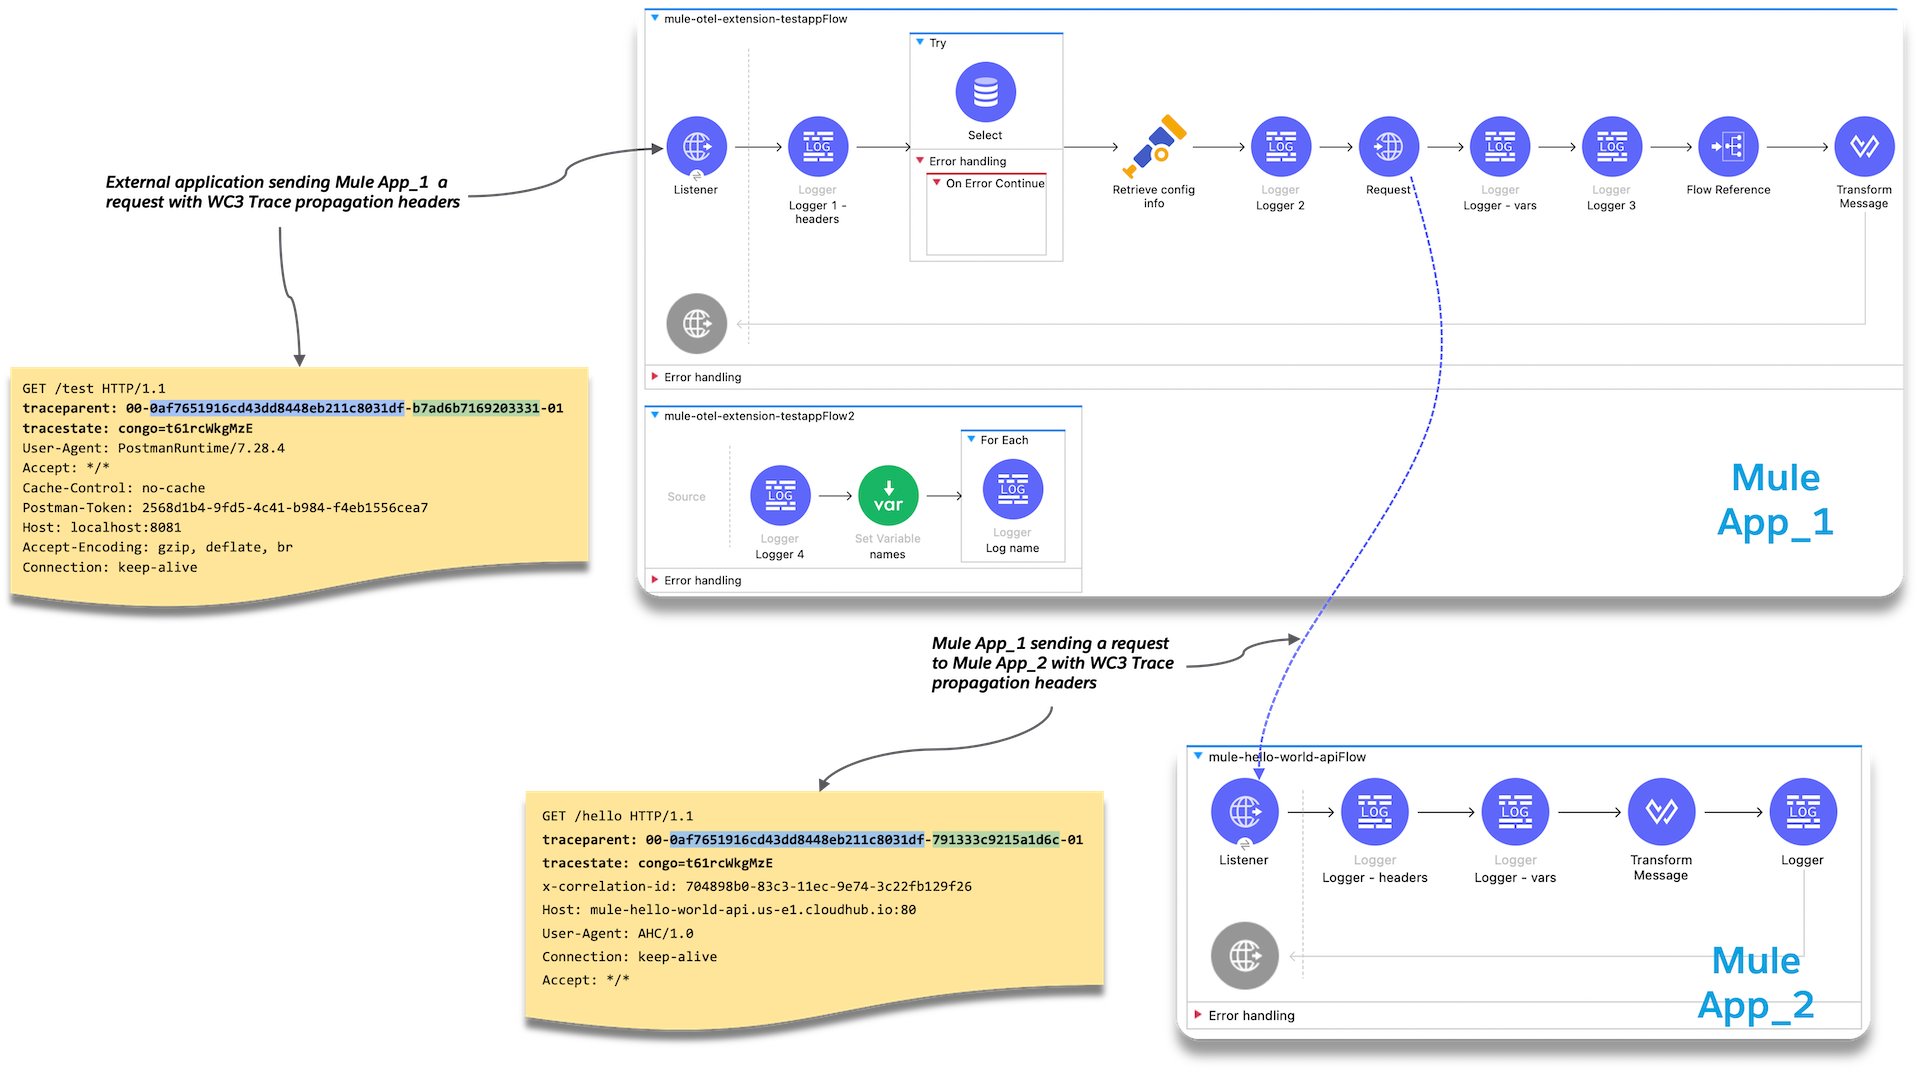
Demo Architecture Mule Implementation Diagram
Below is an implementation of the demo architecture described above. At a high-level, Mule_App_1 receives the initial request from the external client, performs various functions including making a request to an external application, Mule_App_2, and calling a secondary flow within Mule_App_1 before returning a response to the calling client application.
| The demo applications use a variety of Mule components to showcase how different message processors generate different span attributes, including error events and log output. |
Example Output - Dynatrace Backend
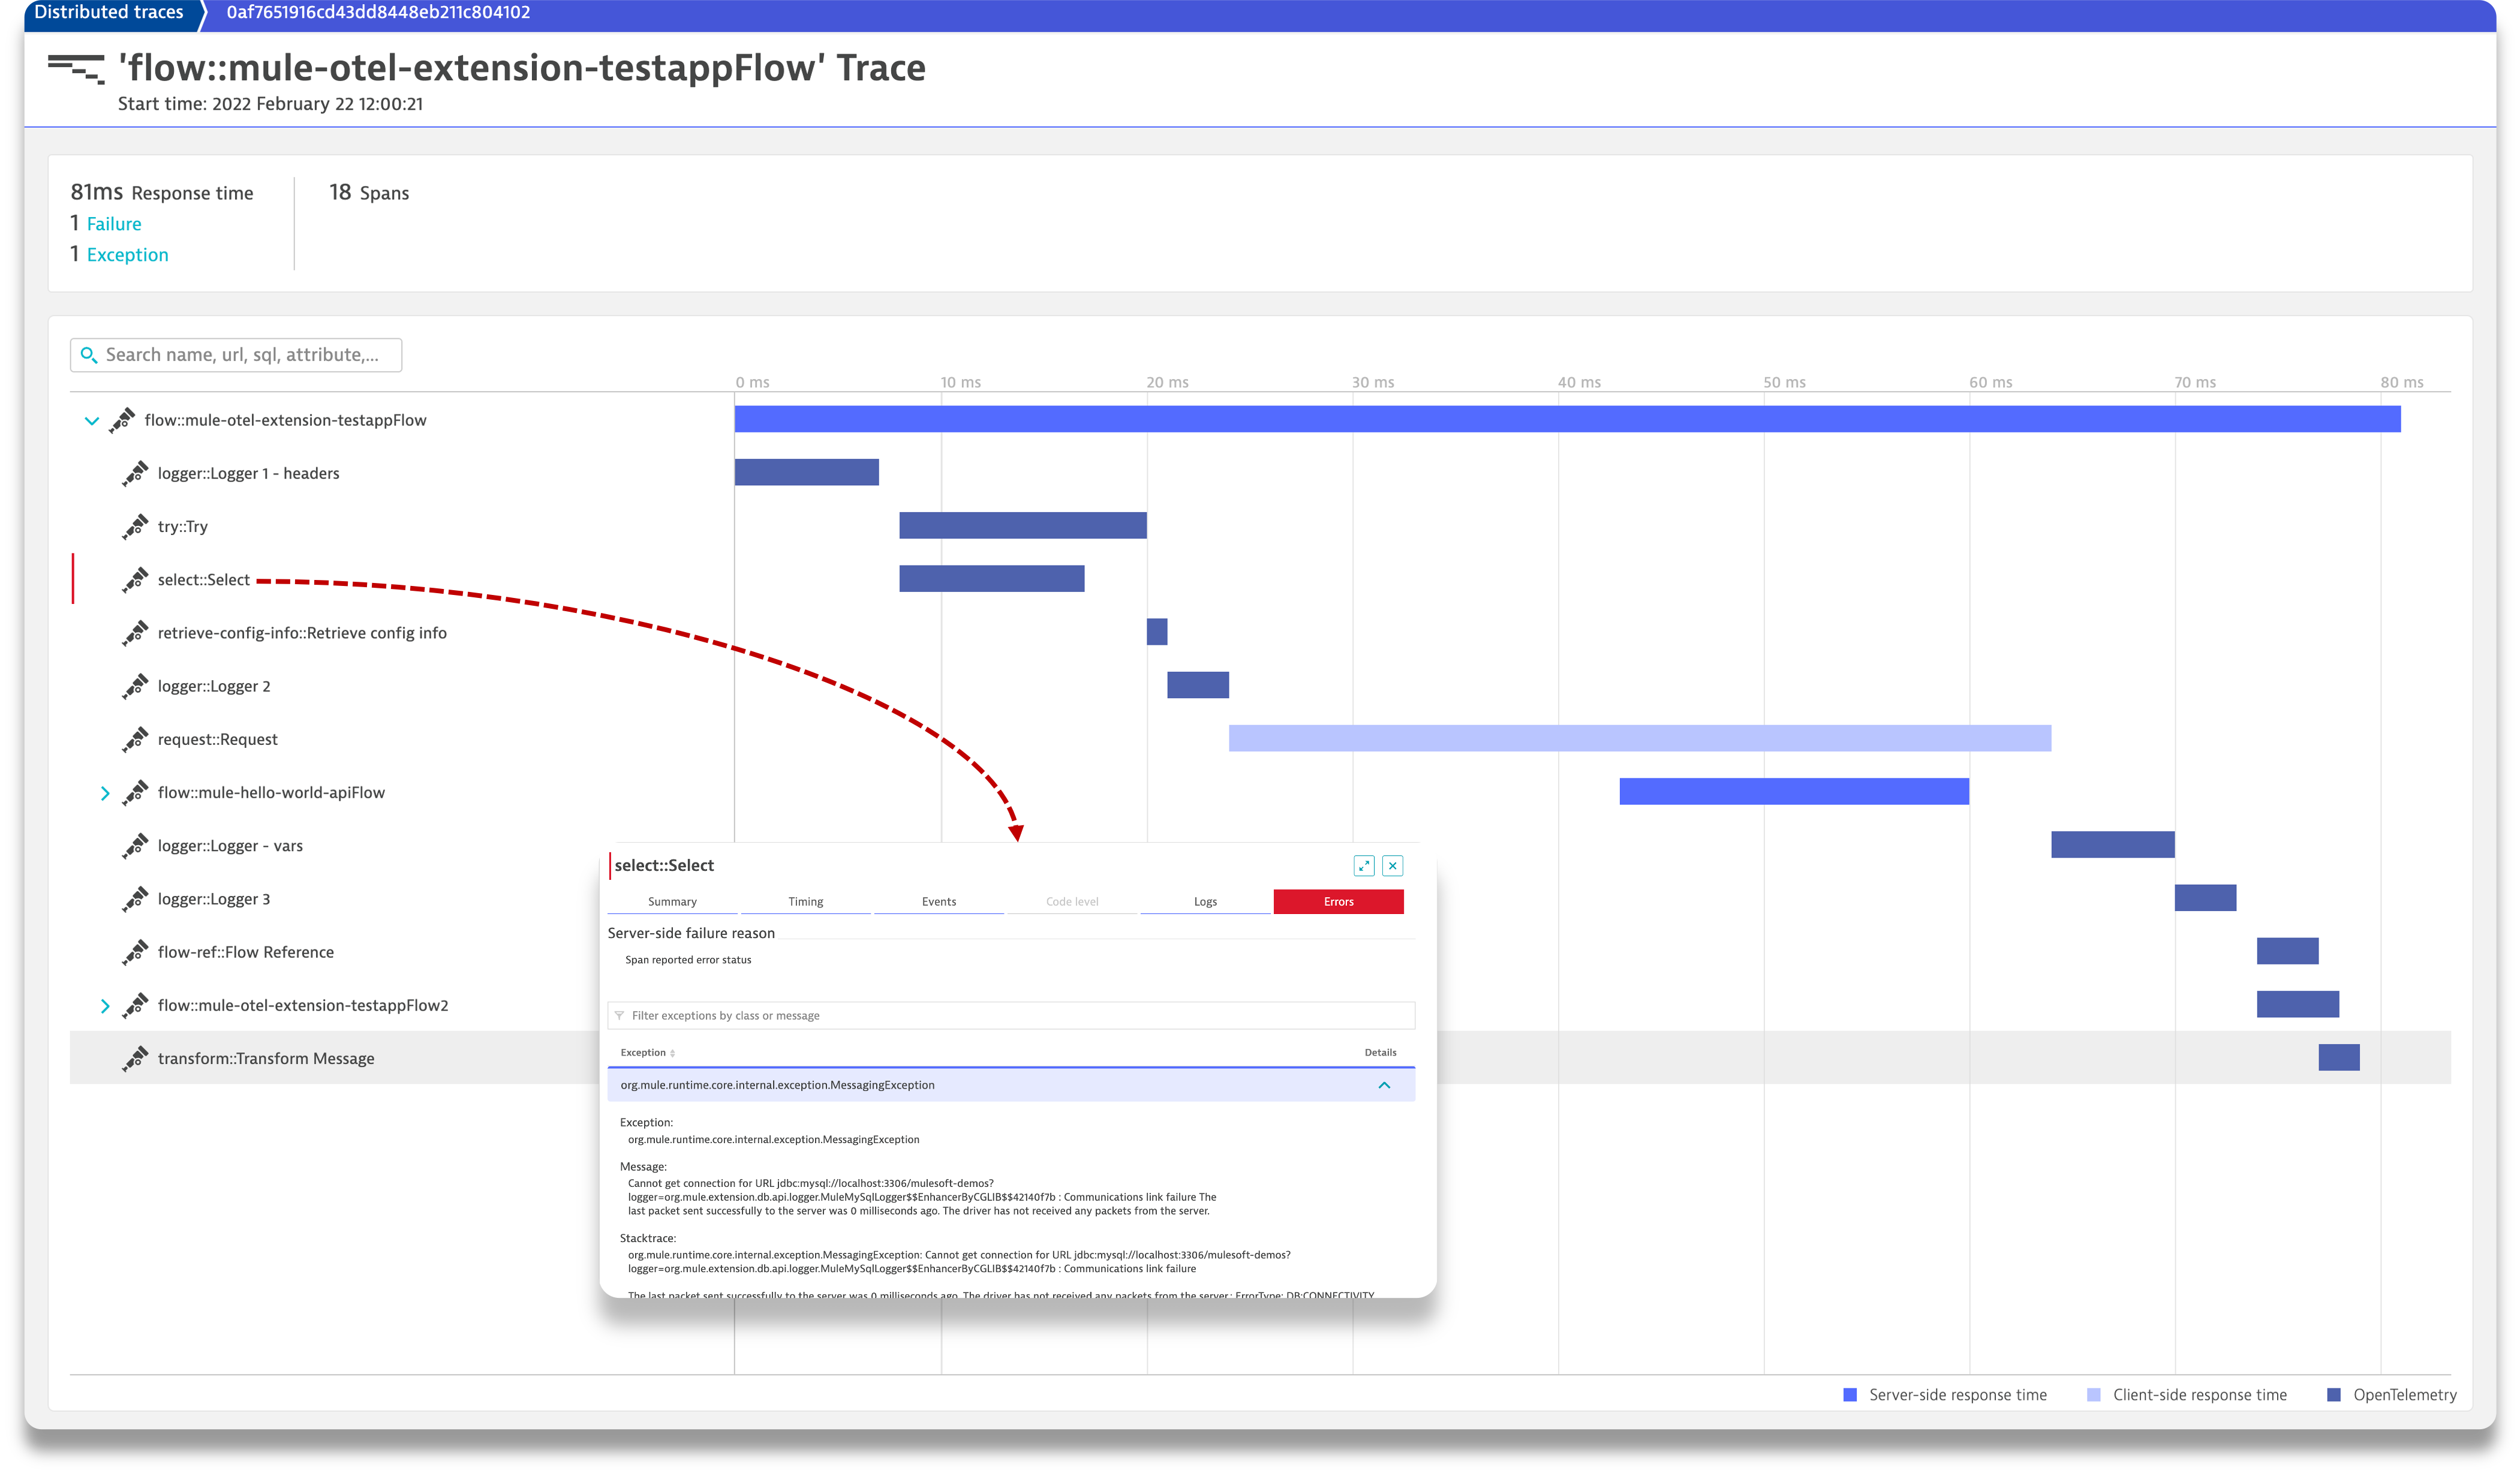
Below are several screenshots from a Dynatrace Distributed Traces Dashboard to provide examples regarding the type of output generated by the Mule 4 OpenTelemetry Module and visualized by observability backend.
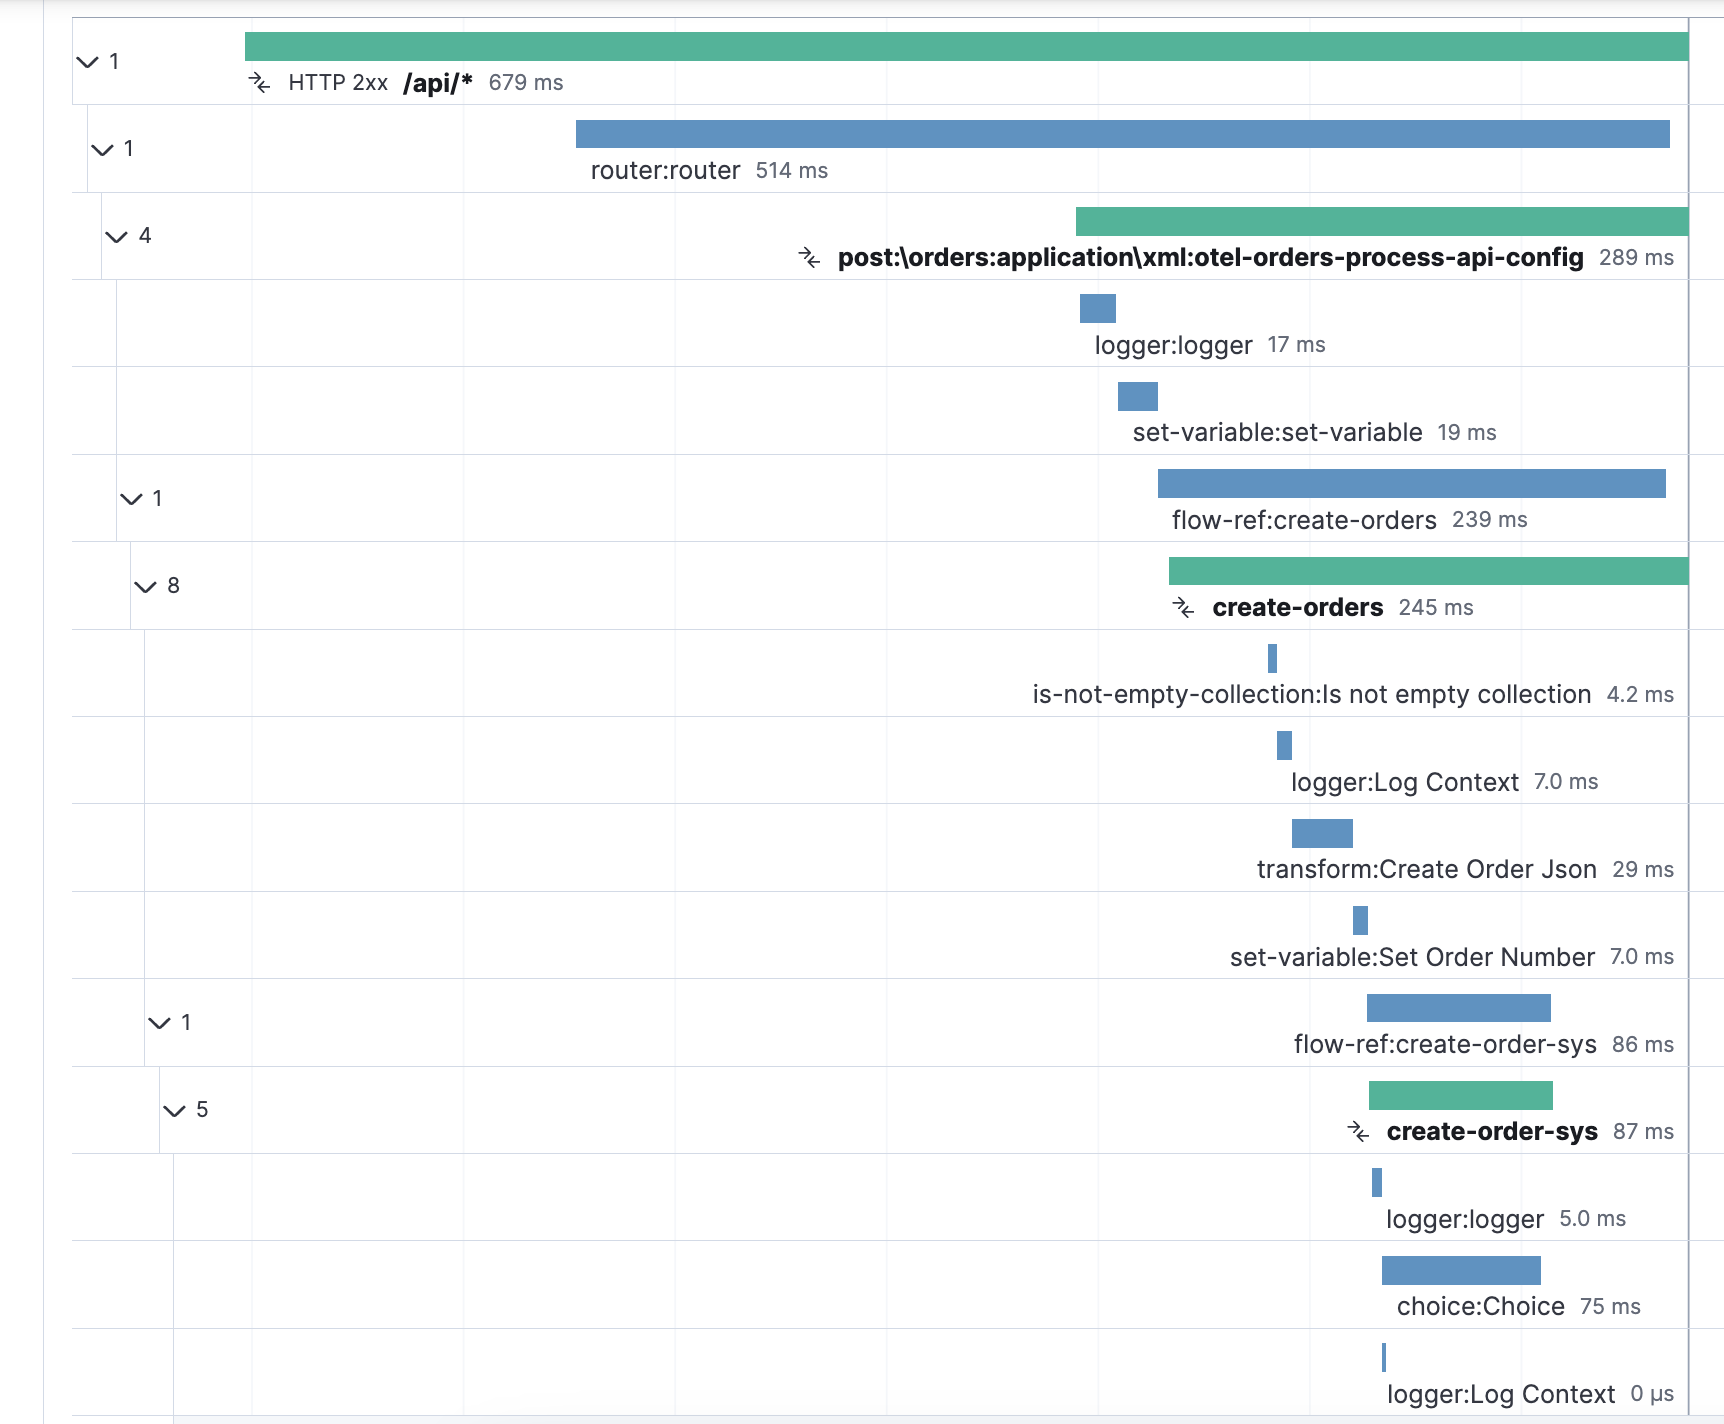
Overall Distributed Trace Temporal Graph
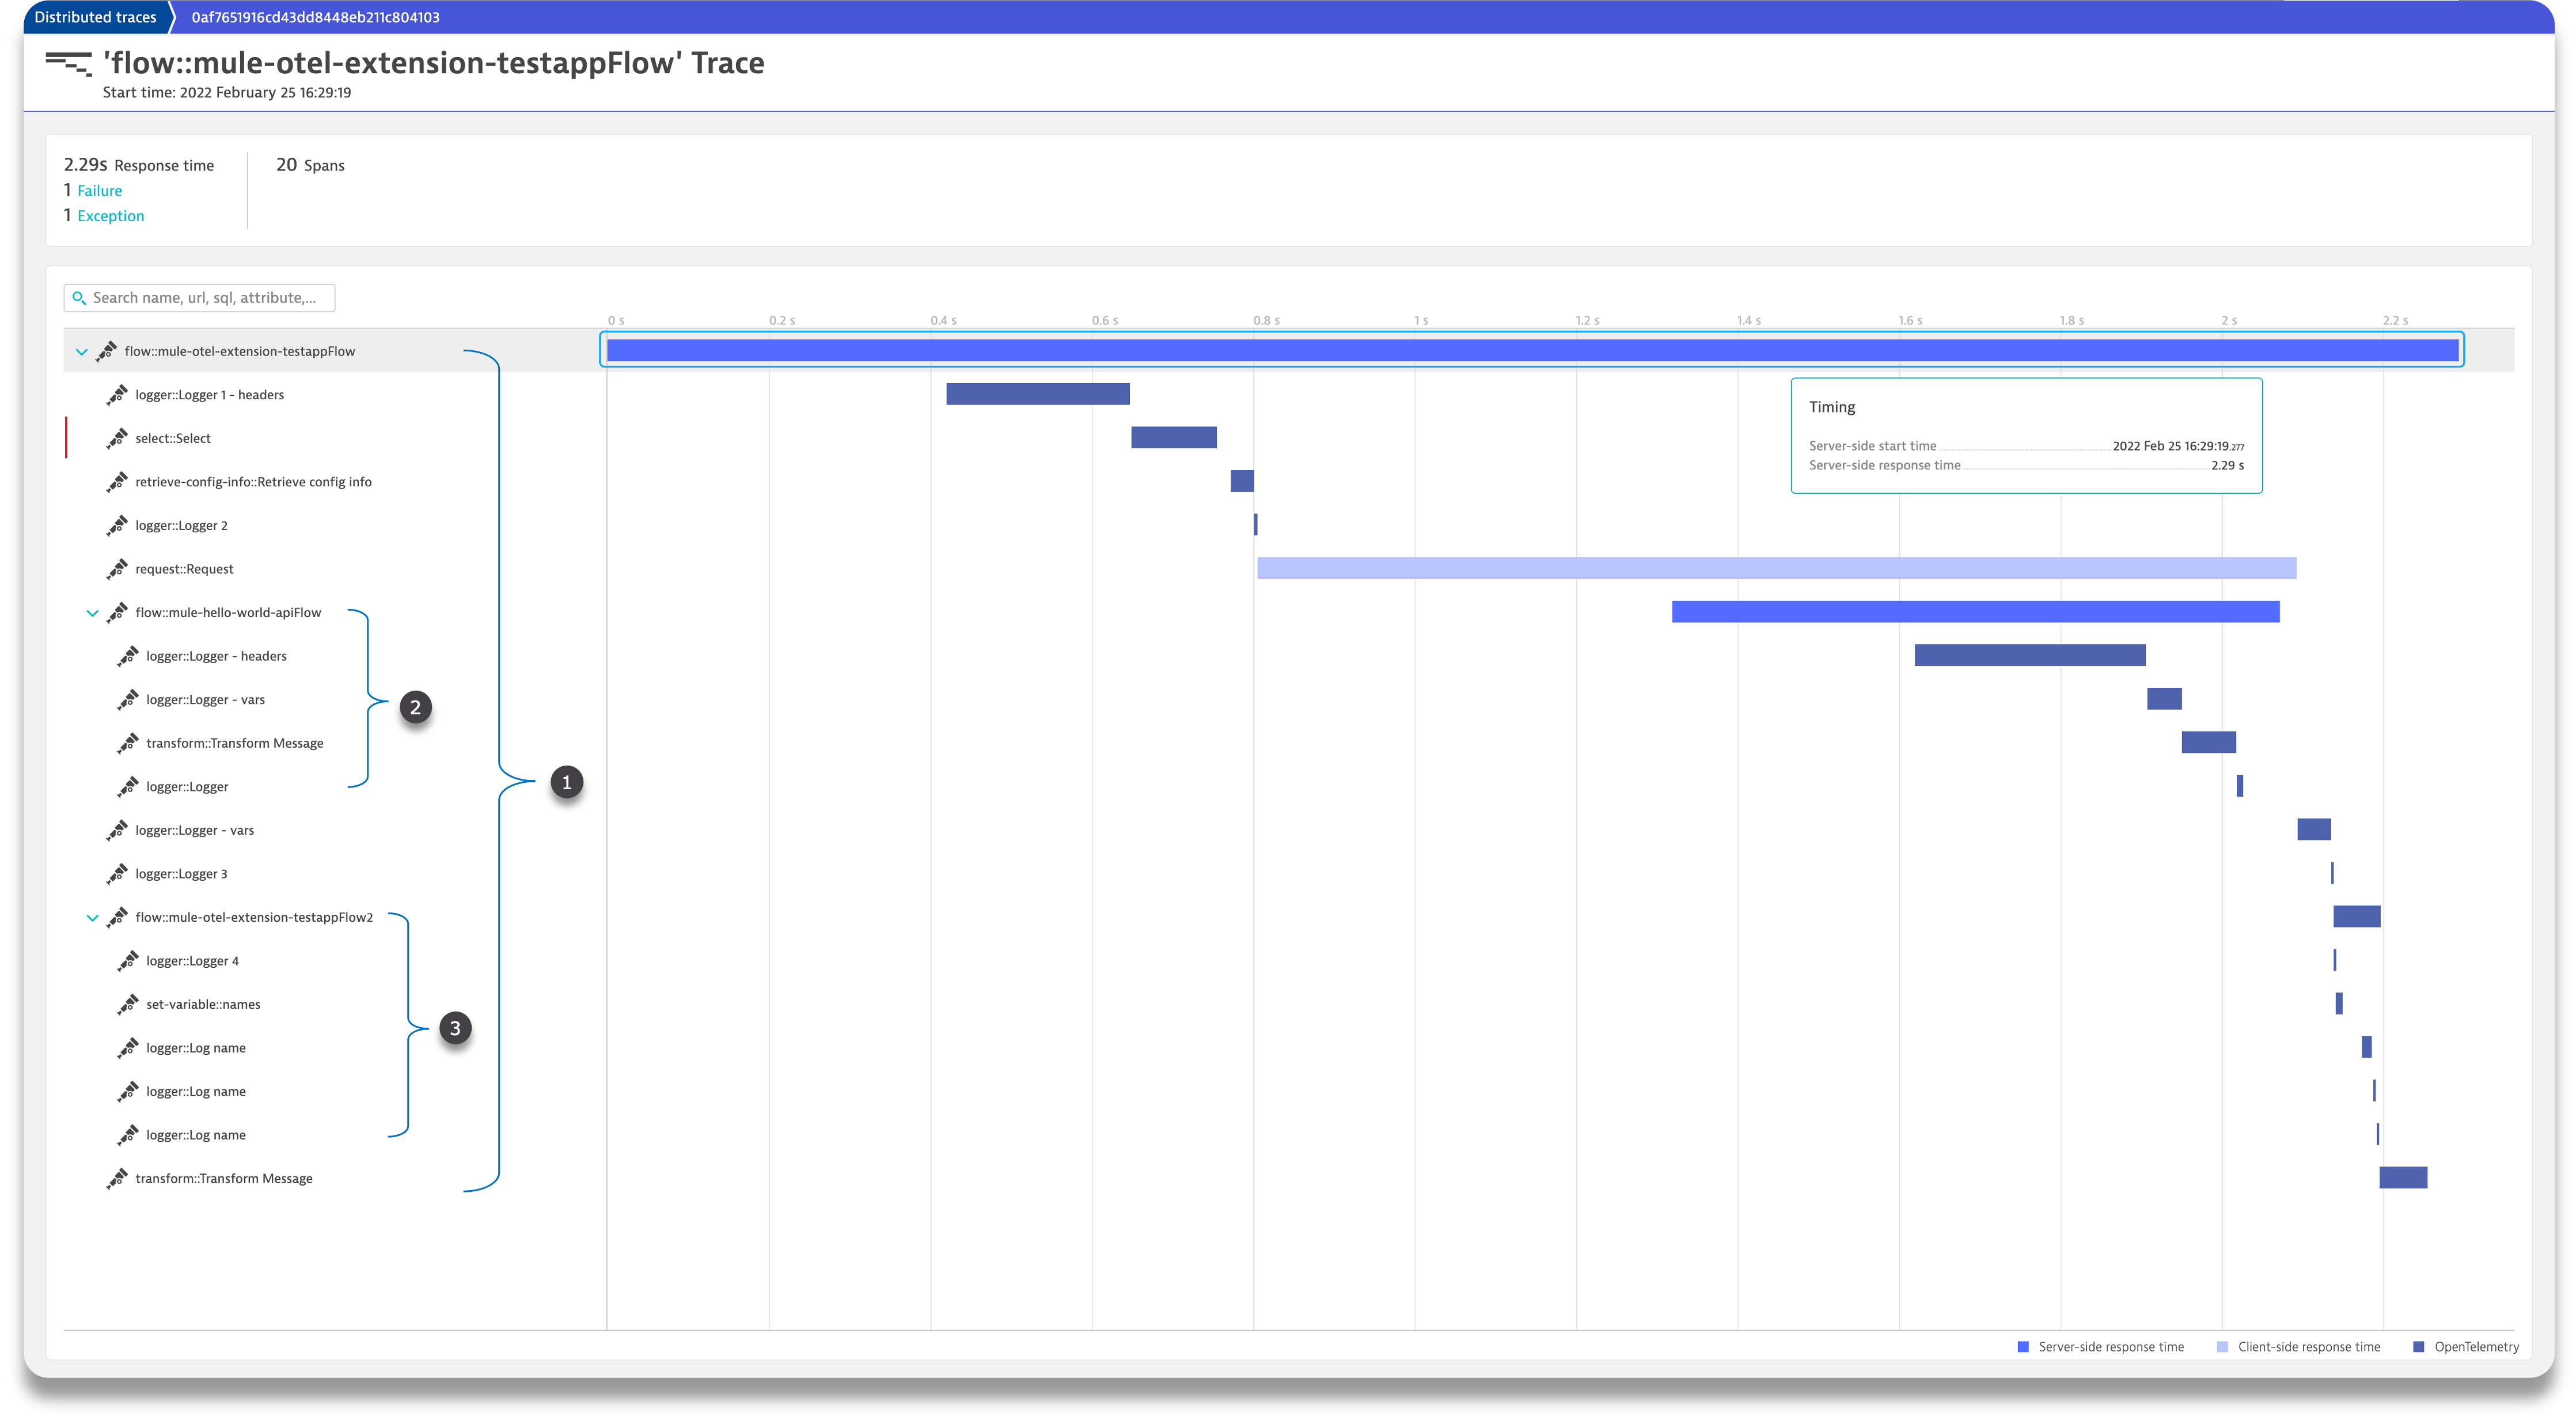
As you can see in the graph above, the Agent generates spans in a manner which is hierarchically consistent with the progression of a transaction through and between Mule applications.
| 1 | Represents the overall set of spans in the distributed trace. Nested (child) spans are indented appropriately at each level. |
| 2 | Represents the overall set of spans associated with the external Mule application (Mule_App_2). Nested (child) spans are indented appropriately. |
| 3 | Represents the overall set of spans associated with the secondary flow in Mule_App_1. Nested (child) spans are indented appropriately. |
Root Span Summary Details
Below is a screenshot of the summary details associated with a Mule Flow (Pipeline) span. In this case, it’s the trace root span which has an HTTP Listener as its source trigger. For the HTTP Listener, the Agent generates attributes such as the HTTP method, the protocol (HTTP or HTTPs), the URI, the remote address, etc.
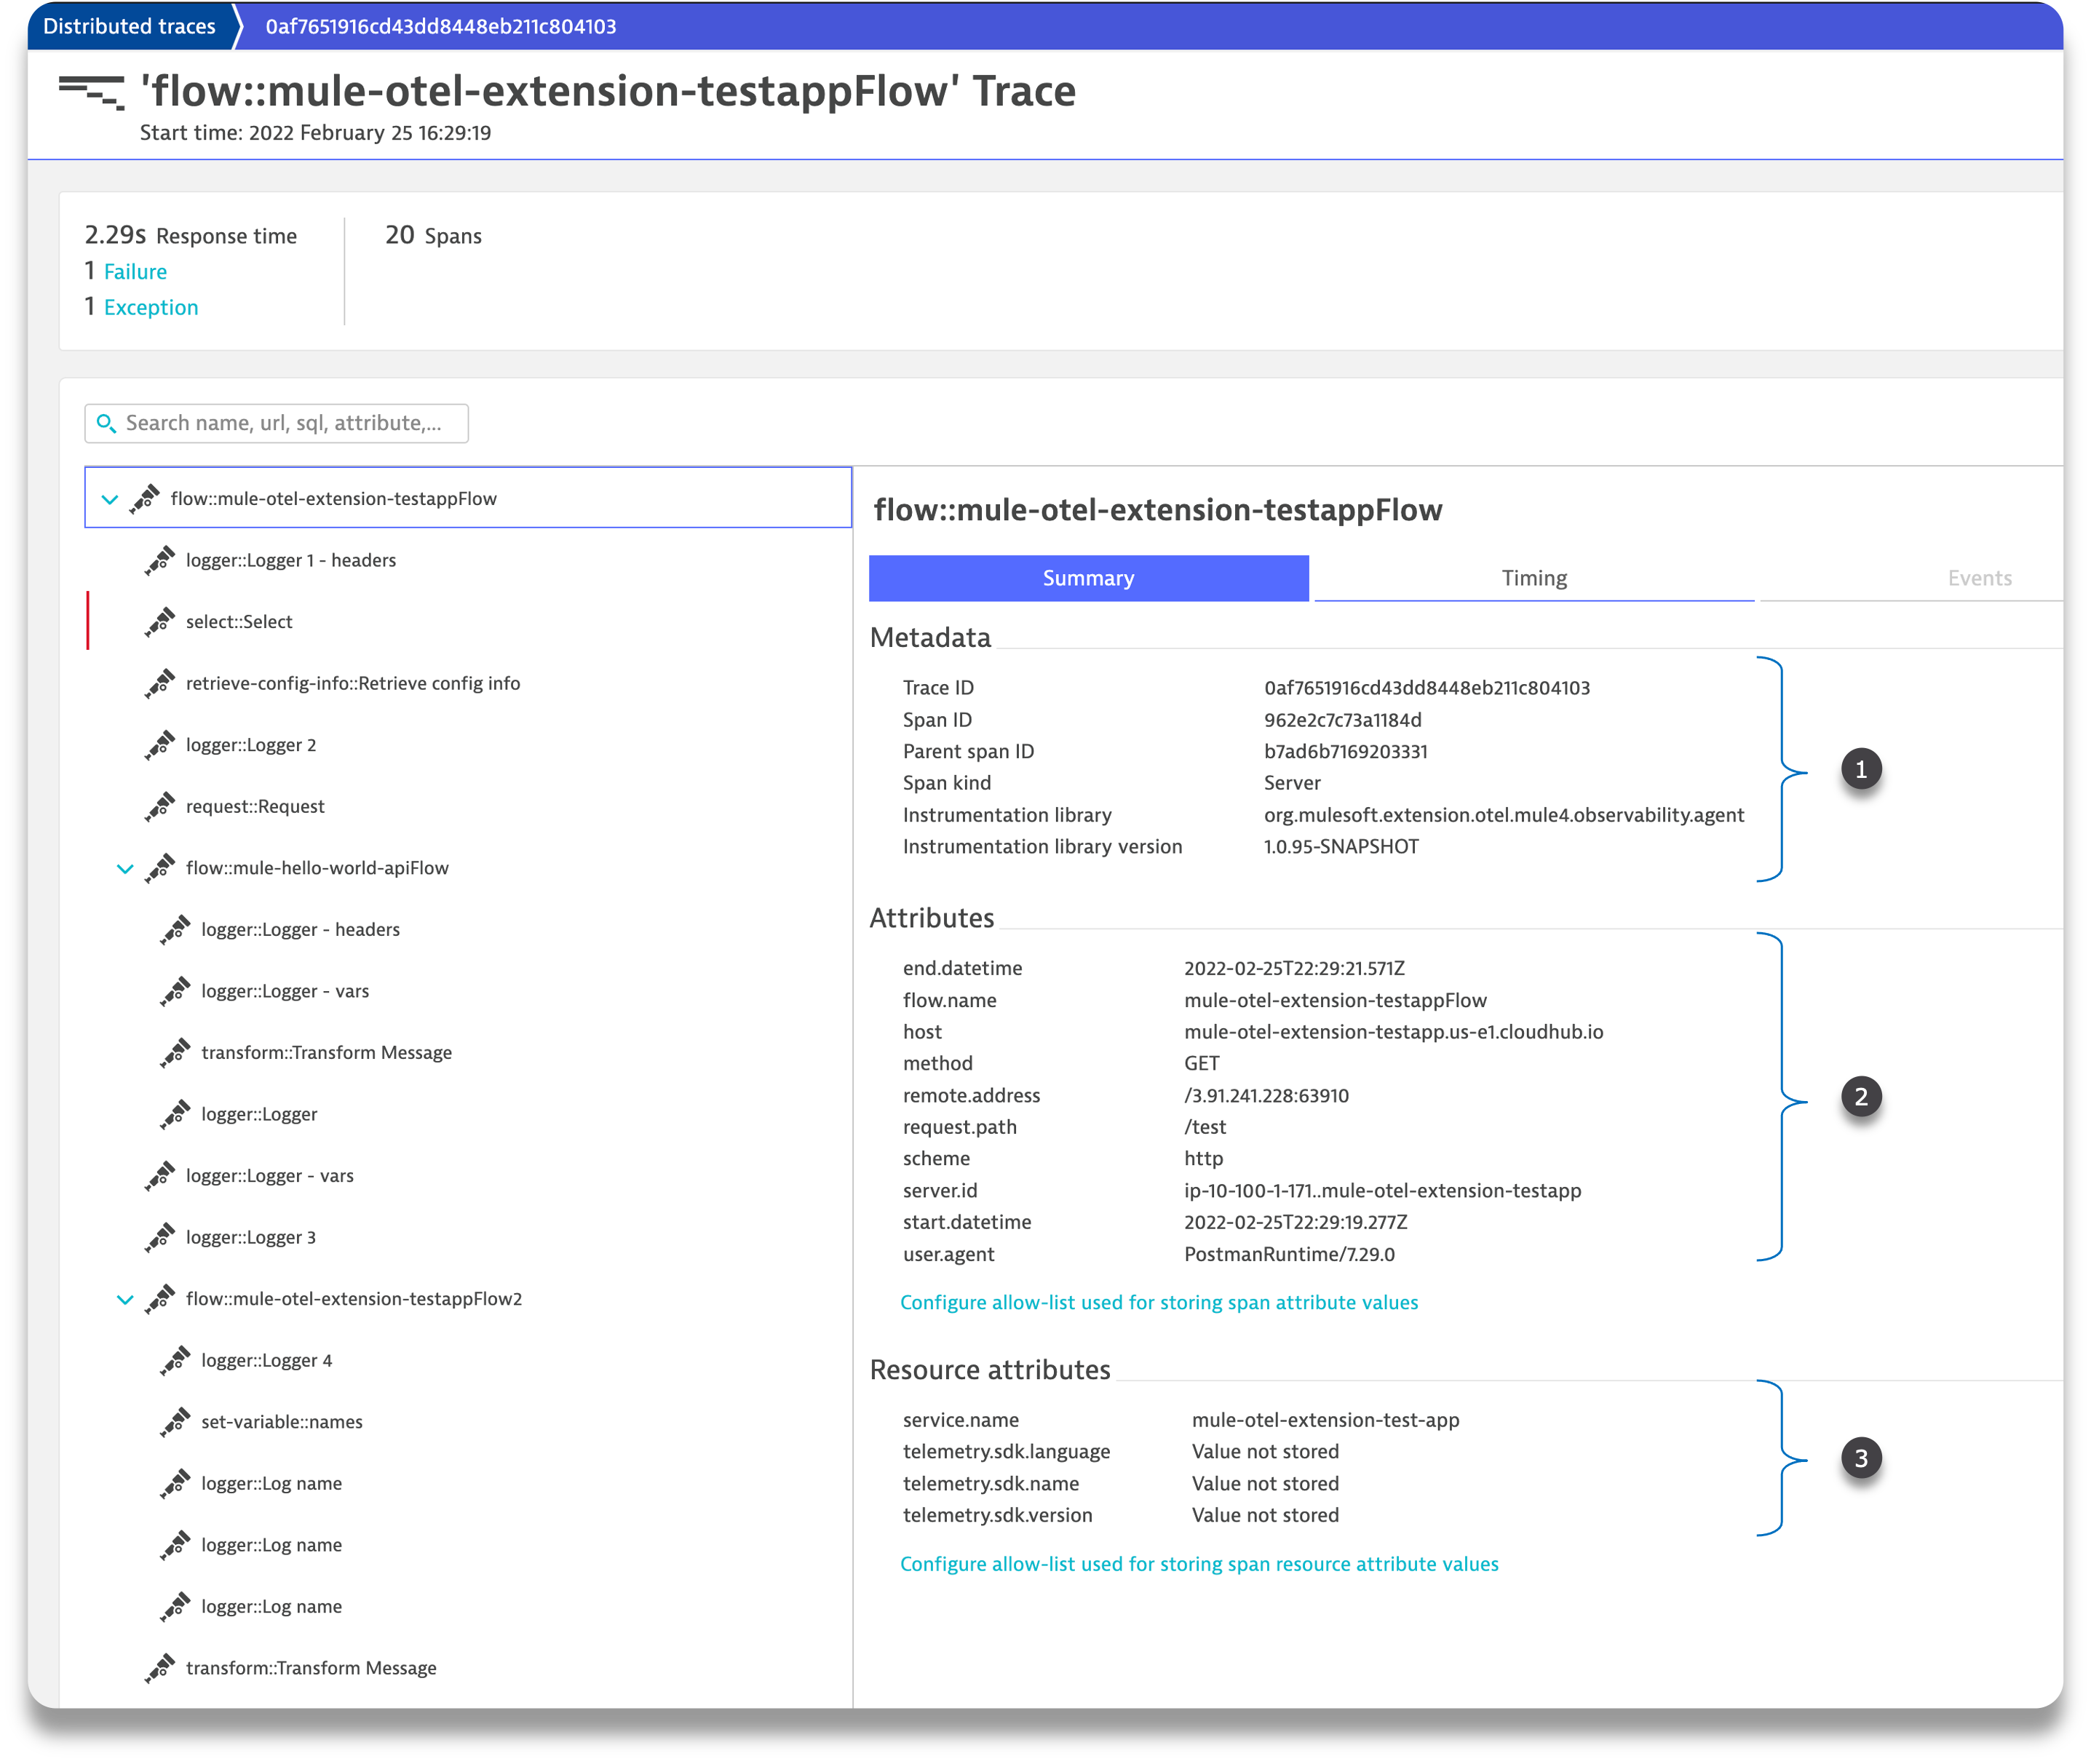
| 1 | The Metadata is generated automatically by the OTel SDK. |
| 2 | The Attributes data is generated by the Agent and specific to the span type, either a Flow(Pipeline) or Message Processor span and if a Message Processor span then Message Processor type (e.g. Logger, Transform, DB, HTTP Requester, …). |
| 3 | The Resource Attributes are specified in the configuration of the Agent. Resource Attributes can be a very convenient and meaningful way of tagging the trace with information such as the application name, runtime environment (e.g., Production, QA, Development,…), hosting region, etc. for easier correlation and search. |
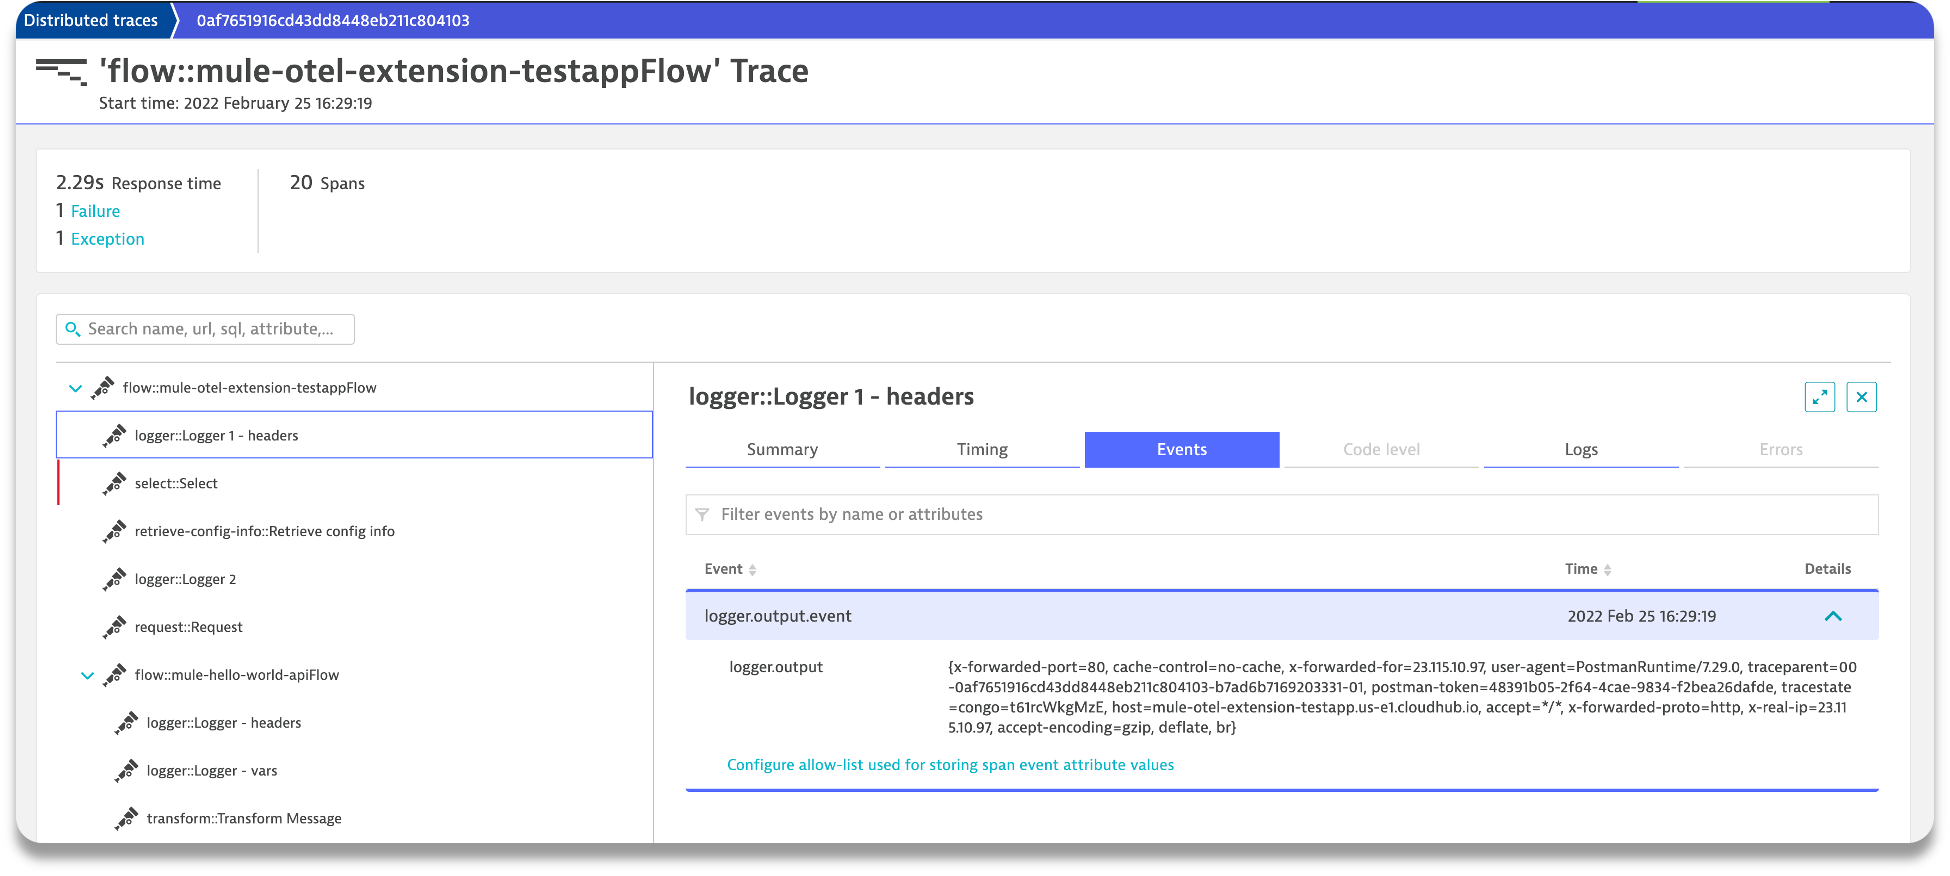
Logger Message Processor Output
As a matter of convenience, the Agent exports the output of the Logger processor.
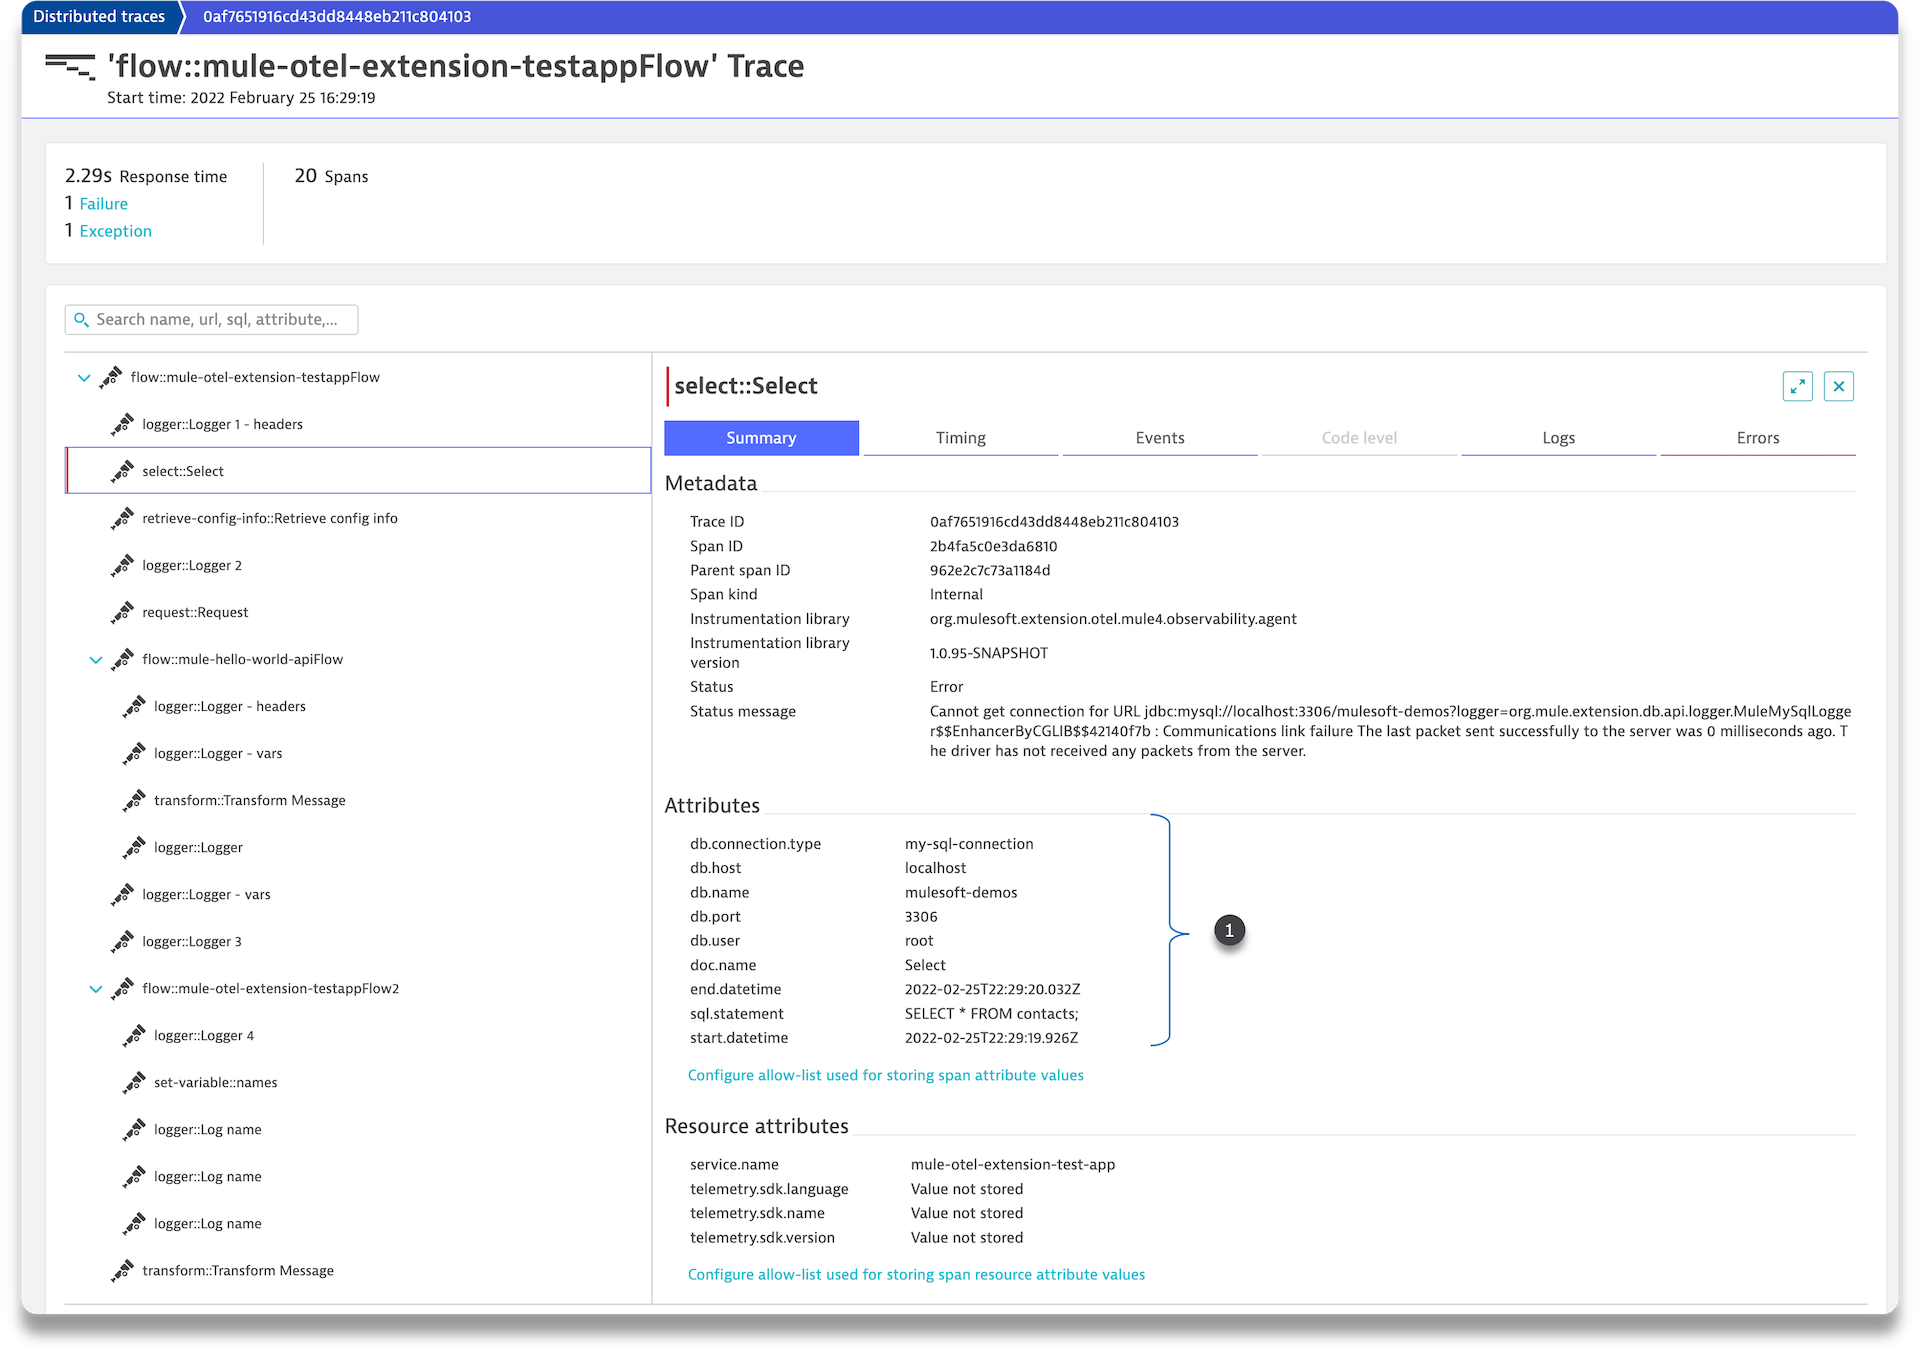
Database Processor Summary
Below is a diagram of the Database Processor specific attributes. The extension will generate connection related attributes such as connection type, host, port, database name and user as well operational attributes such as the SQL query type and statement.
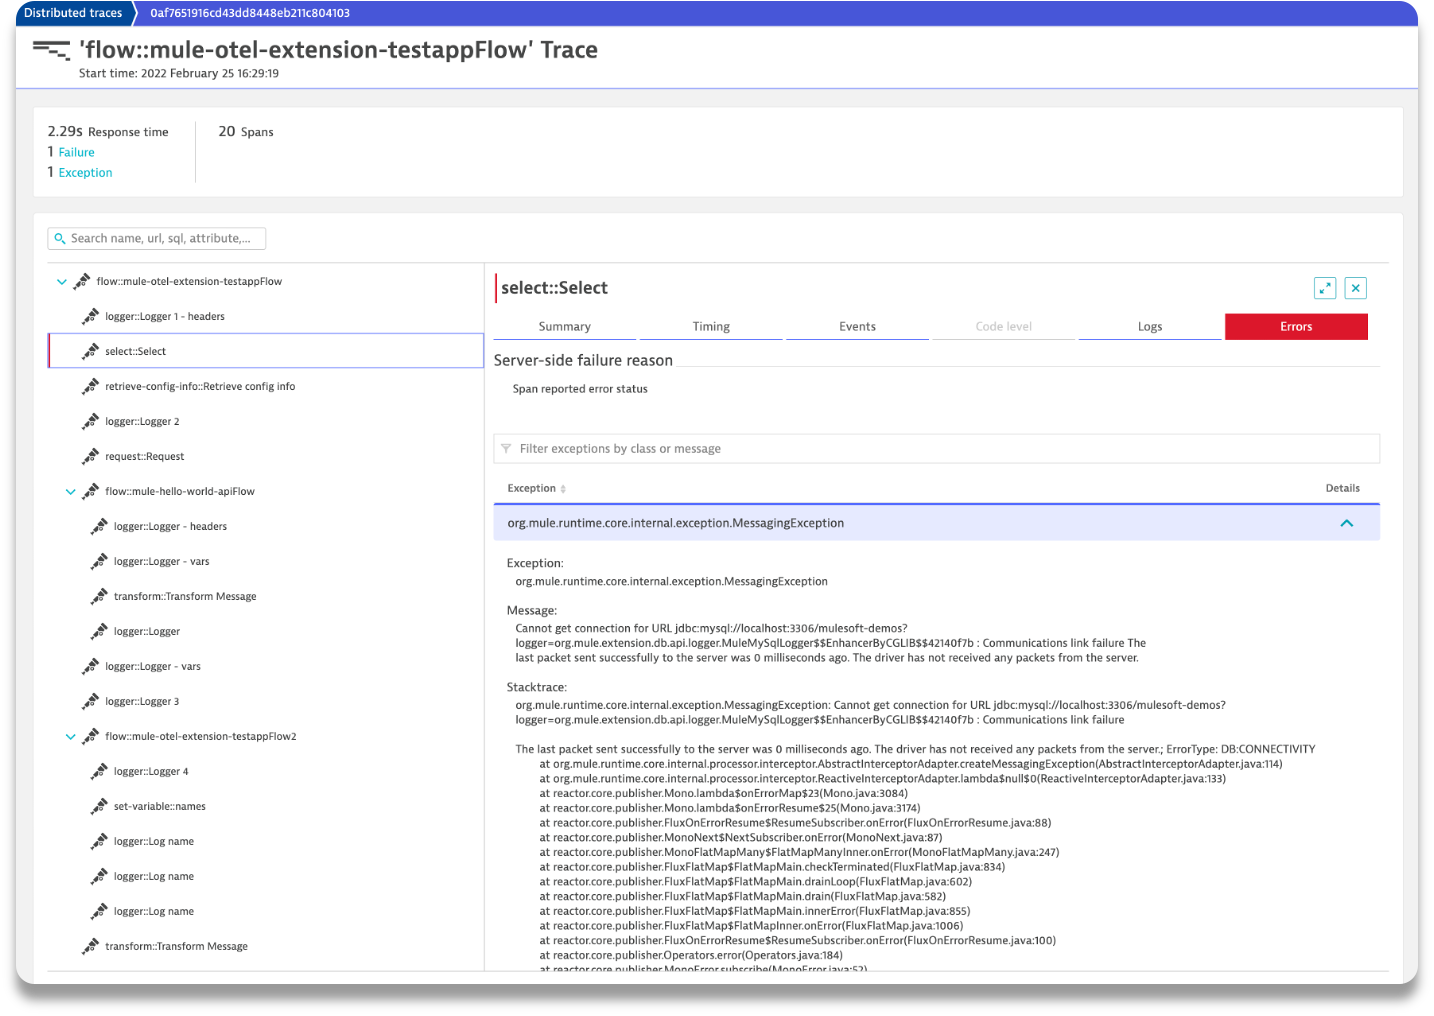
Database Processor Error Event
To facilitate triaging and remediation of faults, when an error occurs in a Mule application, the Agent exports the entire Mule exception message. For example, see the diagram below that displays a database connection failure. Rather than scrolling through external log files, a user can simply look at the trace to find faults.
APM - Splunk Observability Cloud
Splunk APM is one of the product in Splunk Observability Cloud. It is for Instrumenting custom-built applications, serverless functions, and custom-instrumentation data for server side applications.
Configuration
Splunk provides the Splunk Distribution of OpenTelemetry collector to send OpenTelemetry based trace data to APM.
Once you have the collector installed and configured, you can use the module’s OTLP Exporter to send trace data to Splunk Observability Cloud.
    <opentelemetry:config name="OpenTelemetry_Config"
        serviceName="${domain}"
        spanAllProcessors="true">
        <opentelemetry:resource-attributes>
            <opentelemetry:attribute key="mule.env"
                value="${mule.env}" />
            <opentelemetry:attribute
                key="deployment.environment" value="${mule.env}" />     (1)
        </opentelemetry:resource-attributes>
        <opentelemetry:exporter>  (2)
            <opentelemetry:otlp-exporter
                collectorEndpoint="${otel.collector.endpoint}">     (3)
            </opentelemetry:otlp-exporter>
        </opentelemetry:exporter>
</opentelemetry:config>| 1 | Add deployment.environment resource attribute to enable Service Dependency maps. |
| 2 | Use OTLP Exporter configuration to export traces to Splunk |
| 3 | Configure OTLP Endpoint URL (eg. http://localhost:4317) to receive traces. |
Trace Examples
Here is how a trace would look in Splunk APM -
| Splunk generates Inferred Services based on span attributes. You may need to set additional tags to correctly represent the services. See adding Global Config Span tags. |
Trace attributes are available when you expand individual span.
APM Test Matrix
Below is a list of the various backends the extension has been tested with so far:
Backend |
Export Protocol |
Note |
Dynatrace |
OTLP/HTTP_PROTOBUF |
|
Grafana Labs Tempo |
OTLP/HTTP_PROTOBUF |
|
ELK Stack v7.14.2 (Elasticsearch, Kibana, APM Server) |
OTLP/gRPC |
HTTP_PROTOBUF currently not supported by Elastic |
Splunk Observability Cloud - APM |
OTLP/gRPC |
Using Splunk Distribution of OpenTelemetry Collector |
Performance Report
The use of mule-opentelemetry-module can add some overhead to the application performance. The following sections describe the activities performed to understand this overhead.
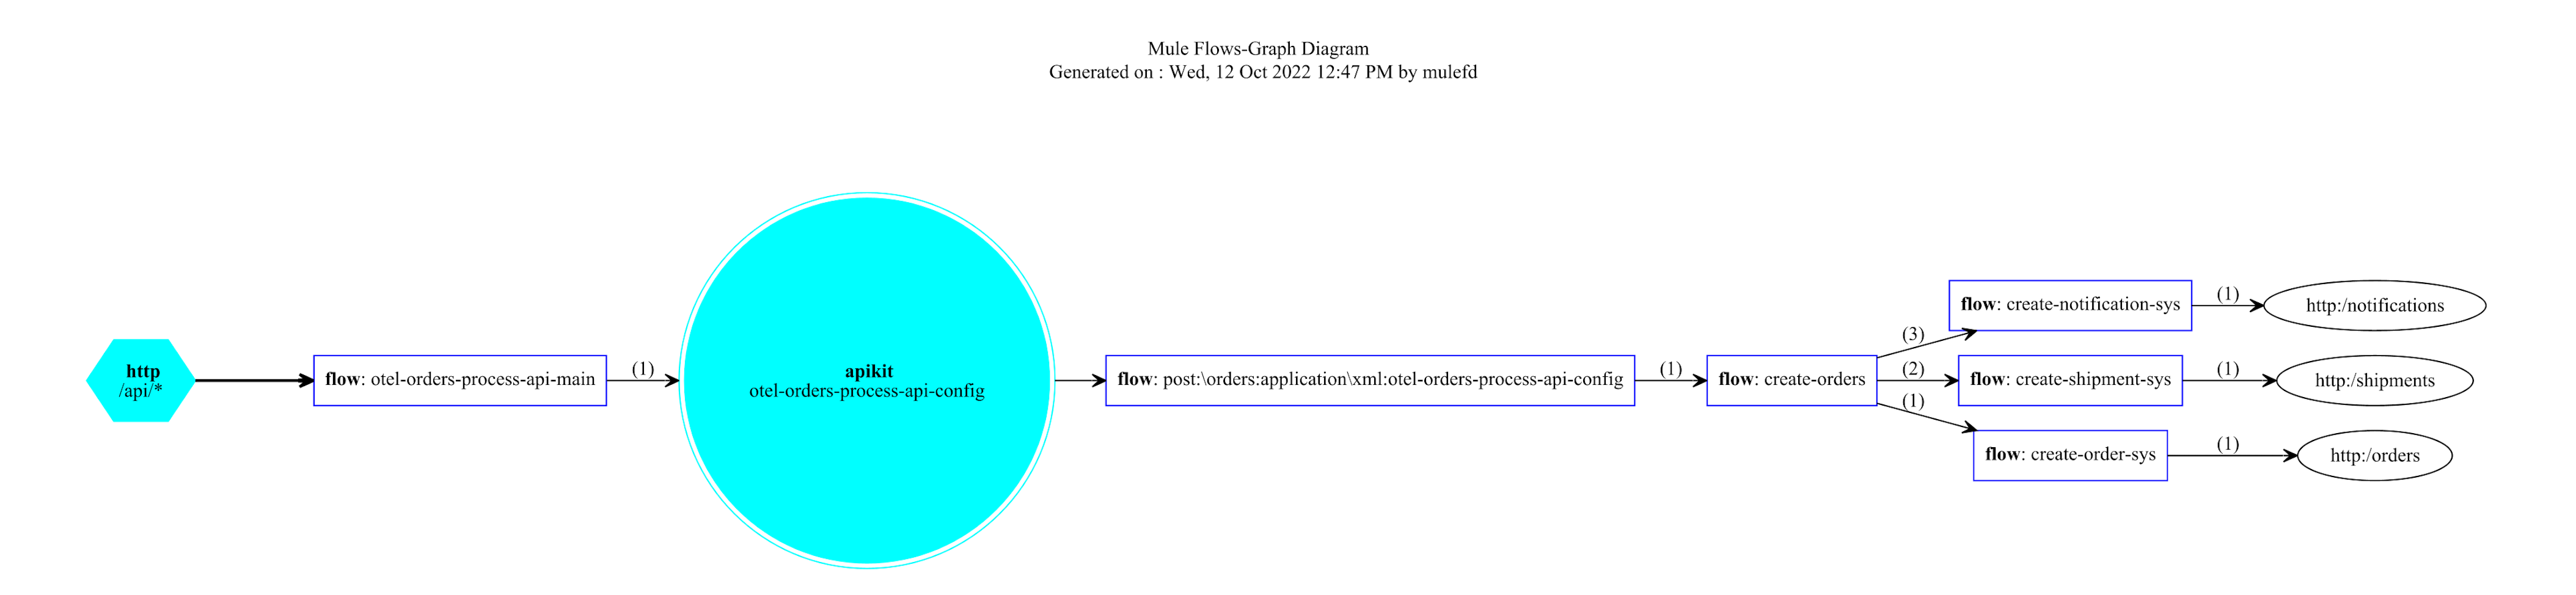
Application Architecture
To execute the performance test, we use an Order Process API that is configured to use this module and send telemetry data to elastic cloud.
In this scenario, the Order Process API integrates with 3 other system APIS - Order System API, Shipments System API, and Notifications System API.
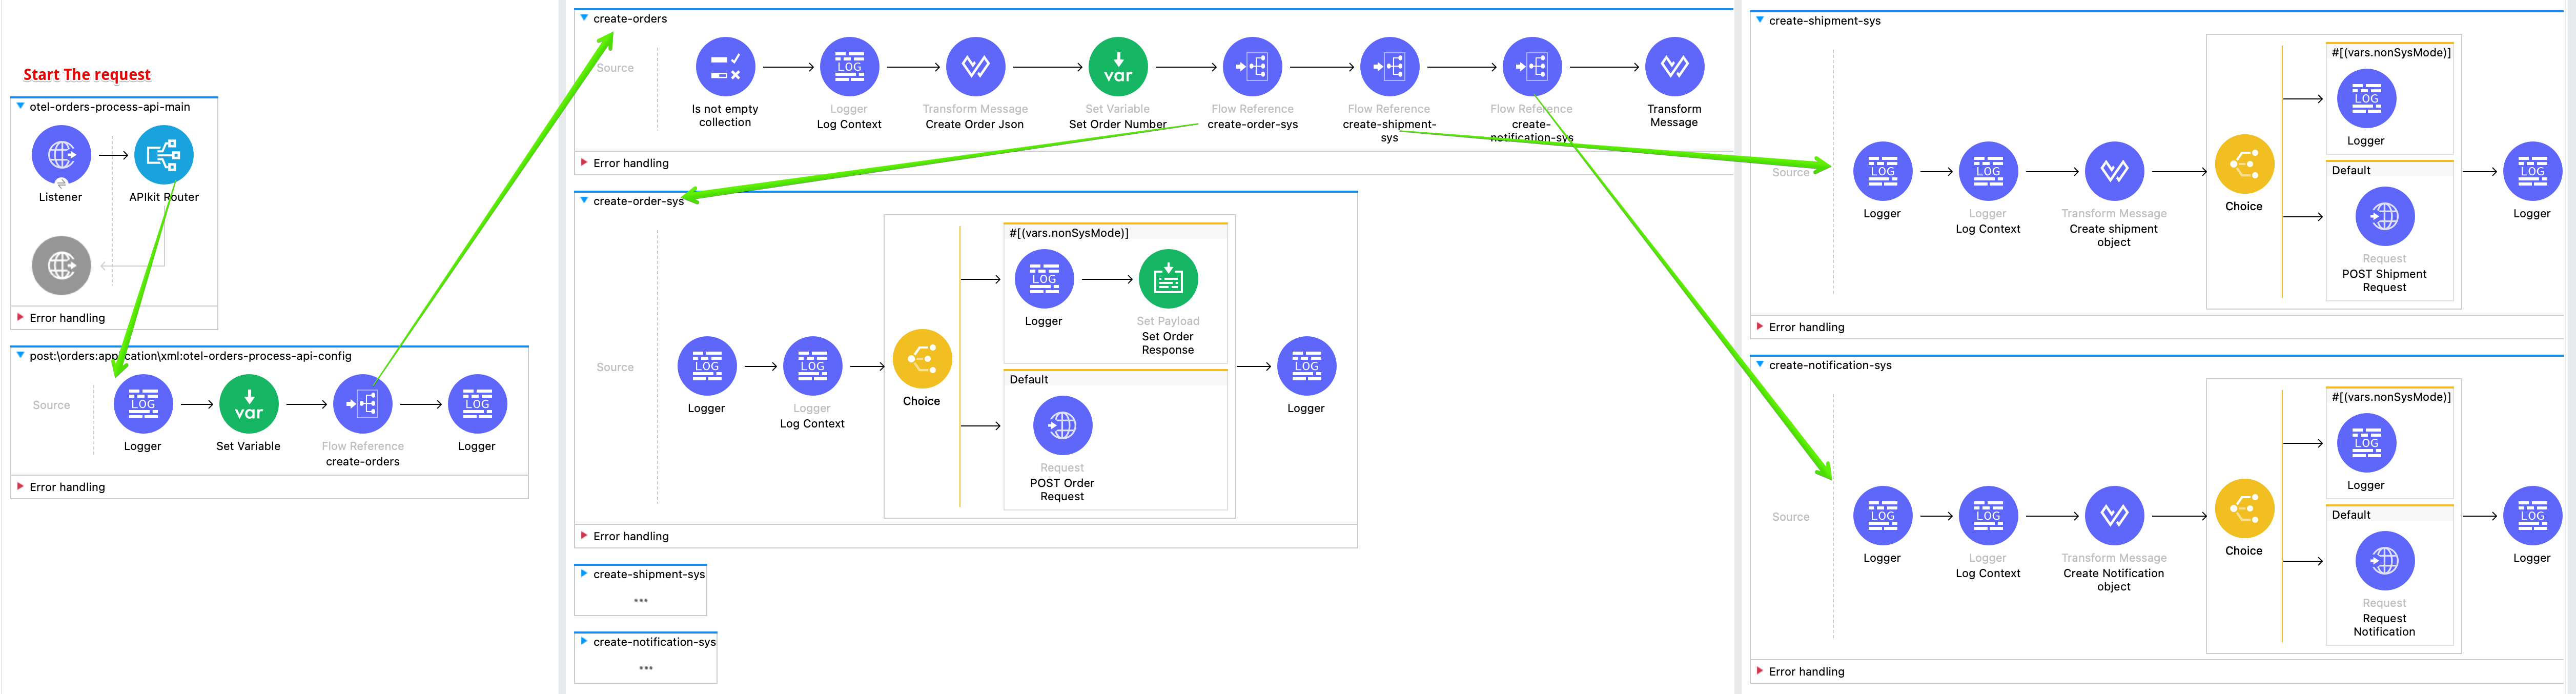
To understand the application at flow level, below image shows how the flows are set up for using various types of connectors, processors, and other modules available in Mule.
Deployment Strategy
The application is deployed to the CloudHub with following setup -
-
CloudHub as a deployment target
-
Single 1 vCore Worker
-
Mule Runtime Version 4.4.0 09-06-2022
Test Setup
To simulate real world scenarios, the system APIs are configured using the mocks to delay responses by predefined times. Following were the test parameters -
-
Deployed two instances of the test Application - One with the OpenTelemetry module and one without OpenTelemetry module
-
Module configured to generate spans for all processors
-
Workload of 100 concurrent requests for 15 minutes
-
Intentional delayed response from System APIs as below
-
Order System API 200 milliseconds
-
Shipment System API 500 milliseconds
-
Notification System API 100 milliseconds
-
Observations
After multiple iterations of the test with above setup and comparing the performance of both applications (with and without OpenTelemetry module), it is observed that using OpenTelemetry module had the following impacts on the application performance -
-
Up to 5% overhead on request processing under the load
-
Up to 10% CPU overhead
Static vs. Dynamic Configurations
Depending on how global configurations are written they can be Static or Dynamic.
-
Static Configuration - A configuration is static when none of its parameters are assigned an expression (even if those parameters do support expressions)
<http:request-config name="HTTP_Request_configuration" doc:name="HTTP Request configuration">
    <http:request-connection host="${sys.greet.http.host}" port="${sys.greet.http.port}" />
</http:request-config>-
Dynamic Configuration - In dynamic configurations, at least one parameter has an expression
<http:request-config name="HTTP_Request_configuration" doc:name="HTTP Request configuration">
  <http:request-connection host="${sys.greet.http.host}" port="${sys.greet.http.port}"
    <http:default-headers>
      <http:default-header key="traceparent"
value="#[vars.OTEL_TRACE_CONTEXT.traceparent as String]" />
    </http:default-headers>
</http:request-config>
For Static configurations, a single instance is created and re-used each time it is needed.
For Dynamic configurations, Each time an operation that points to a dynamic configuration is executed, all the parameters in the configuration are evaluated. A configuration instance is created for each unique set of resolved parameters. In that way, each time the same values are resolved, the same instance is returned, but for each different set of values, a different instance is created.
This lifecycle difference can make a huge difference on the configuration objects created. Every request will have a different traceparent value. Thus, when using Dynamic configurations, a new instance will be created for each request.
Following result demonstrates the configuration Object creations for a load of 20 concurrent users for a 1-minute time period -
Observations:
-
The number of Objects creation and allocation is much higher for Dynamic configurations
-
With configuration expiration window, this affects the memory consumption and GC times
Recommendations:
For higher load applications, static configurations i.e. propagation from operations instead of global configuration should be preferred.
Static Configuration Object Creations


Dynamic Configuration Object Creations

